Measuring and Analyzing the Openness of the Web2.0 Service Network for Improving the Innovation Capacity of the Web2.0 System through Collective Intelligence
Kibae Kim, Jörn Altmann, 황준석 (2010) · IEEE Workshop on Grid Economics and Business Models (GECON) pp. 93-105
Krackhardt-Stern (1988) 의 EI-Index 를 Enhanced-EIS-Indexes (EIS, EIS Subgroup Structure, EIS Agent Behavior) 3 종으로 확장해 웹 2.0 mashup 네트워크의 “개방성” (openness) 을 정량 측정한다. ProgrammableWeb 2005 년 9 월 – 2007 년 5 월 데이터 (219 서비스, 143 ownership subgroup + 47 service-type subgroup) 에서 external·internal·self relationship 3 분류로 EIS = -0.12 (slightly closed), EIS = 0.94 / 0.90 (구조적 high openness), EIS = -0.99 (agent behavior 매우 closed). 즉 기술 구조 는 개방적이지만 agent 의 실제 행동 은 subgroup 내 link 형성을 강하게 선호해 집단 지성 잠재력이 충분히 발휘되지 못함을 보임.
- RQ: 웹 2.0 mashup 네트워크는 실제로 얼마나 개방적이며, 집단 지성 의 전제인 openness 가 산업 수사만큼 작동하는가
- 방법론: 사회 네트워크 분석 (relative relationship values + Enhanced-EIS-Indexes 3 종), EI 지수 (Krackhardt & Stern 1988 의 확장)
- 데이터: ProgrammableWeb 2005 년 9 월 – 2007 년 5 월, 445 Web 2.0 서비스 + 1,929 mashup, isolated 226 제거 후 219 서비스. Subgroup 분류 2 기준: (1) ownership (143 subgroup; 134 개 회사가 단일 서비스만 제공, 9 개만 multi-service), (2) service type (47 subgroup; 34 개가 5 미만 서비스, 1 개만 20+ 서비스)
- 주요 발견: EIS (Enhanced-EI 통합 지수) 양 기준 모두 -0.12 → slightly closed. EIS (Subgroup Structure Index, 구조적 가능성) ownership 0.9386, service type 0.9017 → 구조는 highly open. EIS (Agent Behavior Index, 실제 행동) ownership -0.9917, service type -0.9914 → user 가 subgroup 내 link 를 압도적으로 선호. Time-series: 외부 link 비율은 시간에 따라 superior 해지나 (산업 수사 일치), agent 의 normalized 행동은 매우 closed
- 시사점: Web 2.0 의 기술 구조 와 사회·경제 행동 사이 큰 gap 존재. 진정한 open innovation 잠재력 활용을 위해서는 cross-subgroup 협력 (대형 플랫폼 간 mashup) 을 활성화하는 정책·디자인 개입 필요
요약
황준석 · Jörn Altmann · Kibae Kim 트리오의 Web 2.0 진화 연구 2 편. 선행 paper The structural evolution of the Web 2.0 service network 가 power-law exponent (일반 scale-free 2~3 보다 훨씬 낮음) 의 비정상 을 발견한 데 이어, 본 paper 는 그 원인 중 하나로 subgroup 구조 (소유주·서비스 유형 기반) 가 네트워크 진화를 제약 한다는 가설을 정량 검증한다.
배경: 개방형 혁신 (Chesbrough 2003) 과 집단 지성 (Tapscott & Williams 2008) 이론은 openness 가 innovation 의 전제 조건이라 주장 — Silicon Valley 의 인력 mobility 가 R&D 센터 ↔ start-up 지식 흐름을 가능케 한 사례 (Castilla et al. 2000) 가 정전. Web 2.0 는 기술적으로 open API 를 제공해 user 가 mashup 으로 collective intelligence 를 발현할 수 있다고 산업이 주장하지만, 사회·경제적 barriers (회사 간 경쟁, 학습 비용) 가 실제 openness 를 제약할 수 있다. 종전 Web 2.0 분석은 기술 측면만 다뤘고 openness 자체 의 정량 측정은 미답 영역이었다.
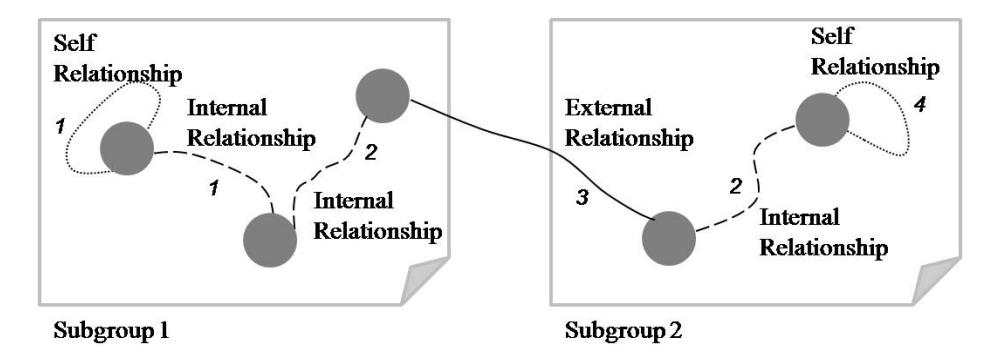
방법론은 Krackhardt & Stern (1988) Social Psychology Quarterly 의 EI-Index 의 두 가지 한계 — (i) binary link weight 만 처리 (mashup 의 반복 사용 미반영), (ii) self-relationship (단일 서비스 mashup) 미분류 — 를 확장. 3 가지 link 유형 정의: external (다른 subgroup 간), internal (같은 subgroup 내), self (단일 서비스 mashup). Enhanced-EIS-Indexes 3 종 도입: (1) EIS = (raw count 기반 통합 지수), (2) EIS = Subgroup Structure Index (network 의 구조적 가능성 — 가능한 최대 link 수 기반), (3) EIS = Agent Behavior Index (normalized — subgroup size 효과 제거 후 agent 의 실제 link 형성 선호). 두 가지 subgroup 분류: (a) ownership (Google·Yahoo·Amazon 등), (b) service type (Map Services·Shopping Services 등).
결과는 기술 구조 vs 사회 행동의 큰 gap 을 정량 입증. EIS (양 분류 모두 -0.12, slightly closed) 만 보면 약간 닫힌 네트워크. EIS (ownership 0.9386, service type 0.9017) 는 구조적으로는 매우 open — 즉 mashup 생성이 다른 subgroup 간 link 를 구조적으로 허용. 그러나 EIS (Agent Behavior, ownership -0.9917, service type -0.9914) 는 agent 의 실제 행동 이 매우 closed — user 가 같은 subgroup 의 서비스를 압도적으로 선호. 이는 (i) user 가 같은 회사 (Google App Engine + Google Maps) 의 API 친숙도 비용이 낮고, (ii) 같은 service type (지도 서비스 간) 의 학습 비용이 낮은 사회·경제적 메커니즘으로 설명. Time-series trend 도 흥미롭다 — relative external relationship value (외부 link 비율) 는 시간에 따라 superior 해지지만, normalized 행동은 일관되게 closed → 산업의 “Web 2.0 = open” 수사는 gross volume 기준일 뿐이며 agent 행동의 selectivity 는 그 수사를 지지하지 않음.
정책 함의는 명확하다 — 진정한 open innovation 잠재력 활용을 위해서는 (i) cross-subgroup 협력 인센티브 (이종 platform 간 mashup 보너스), (ii) 디자인 개입 (cross-platform API 표준화), (iii) developer 교육 (다종 platform 학습 부담 완화) 같은 외부 개입이 필요. 황준석 · Jörn Altmann · Kibae Kim 트리오의 3 편 시리즈 (The structural evolution of the Web 2.0 service network → 본 paper → The Impact of the Subgroup Structure on the Evolution of Networks: An Economic Model of Network Evolution) 의 중간 작업으로, 비정상 power-law exponent 발견 → openness 정량 측정 → subgroup 메커니즘 시뮬레이션 의 narrative arc 완성.
핵심 결과
| 지수 | Ownership 기준 | Service type 기준 | 해석 |
|---|---|---|---|
| EIS (통합 지수) | -0.12 | -0.12 | Slightly closed |
| EIS (Subgroup Structure) | 0.9386 | 0.9017 | 구조적으로 매우 open |
| EIS (Agent Behavior) | -0.9917 | -0.9914 | Agent 행동 매우 closed |
| 데이터 분포 | Ownership | Service Type |
|---|---|---|
| 총 subgroup 수 | 143 | 47 |
| 단일-멤버 subgroup | 134 (94%) | 34 가 5 미만 |
| Multi-멤버 subgroup | 9 (Google·Yahoo·StrikeIron 등) | 1 만 20+ 멤버 (Map Services) |
핵심 명제: Web 2.0 service network 는 기술 구조 (EIS) 면에서 매우 open 하지만 agent 의 실제 행동 (EIS) 면에서 매우 closed. 산업의 “Web 2.0 = open innovation” 수사는 link 의 absolute 비율만 본 것이며, normalize 후 agent 의 selectivity 를 보면 user 는 같은 회사·같은 service type 내 link 를 압도적으로 선호.
방법론 노트
Krackhardt-Stern (1988) 의 EI-Index 정의: , . 모든 link 가 외부 = 1, 모든 link 가 내부 = -1. 본 paper 의 확장 1 — Enhanced-EIS-Index EIS (self-relationship 추가 + weighted link):
여기서 = external, internal, self relationship 의 weighted link 수 (mashup 반복 사용 카운트). 확장 2 — Subgroup Structure Index (가능한 최대 link 수 기반):
이 지수는 subgroup 구조 (size 분포) 가 허용하는 이론적 최대 openness. 확장 3 — Agent Behavior Index (normalized 비율 기반, 등):
이 지수는 subgroup size 효과를 제거한 agent 의 실제 link 형성 선호도. 식별은 (i) 두 subgroup 분류 (ownership vs service type) 의 직교 검증 + (ii) 3 지수의 분해 (gross volume vs normalized behavior) 에서 온다. 데이터: ProgrammableWeb 의 219 서비스 (isolated 226 제거 후) + ownership 143 subgroup + service type 47 subgroup. Time-series 분석은 cumulative monthly 데이터 (2005 년 9 월 - 2007 년 5 월) 로 trend 검증.
연구 계보
직접 선행: Krackhardt & Stern (1988) Social Psychology Quarterly “Informal Networks and Organizational Crises” — EI-Index 정전. The structural evolution of the Web 2.0 service network Online Information Review — 본 paper 의 직접 motivation (낮은 exponent 의 원인 추적). Chesbrough (2003) Open Innovation — open innovation 정전. Tapscott & Williams (2008) Wikinomics — collective intelligence + 4 enabler (openness, sharing, acting globally, peering) 정의. Castilla et al. (2000) Silicon Valley 인력 mobility + 지식 흐름. Gawer & Cusumano (2002) Platform Leadership — Intel·Microsoft·Cisco 의 platform openness 전략. Henkel (2006) Research Policy 의 embedded Linux selective revealing. Burt (1994) Brokerage and Closure + Lin (2001) Social Capital — social capital theory. Walter, Lechner & Kellermanns (2007) Journal of Business Research — inter-firm vs intra-firm innovation 의 hub-client vs redundant-ties 구조 분석. Muller-Prothmann, Siegbert & Finke (2005) Fraunhofer Knowledge Management Group EI-Index 적용. Julsrud (2007) Scandinavia 다국적 R&D EI-Index. Levy (2010) Information Sciences “From Social Computing to Reflexive Collective Intelligence”. 황준석 · Jörn Altmann · Kibae Kim 트리오의 웹 2.0 라인 3 편 시리즈의 중간 작업.
See also
- 황준석
- Kibae Kim
- Jörn Altmann
- IEEE Workshop on Grid Economics and Business Models (GECON)
- 사회 네트워크 분석
- EI 지수
- 웹 2.0
- 집단 지성
- The structural evolution of the Web 2.0 service network
- The Impact of the Subgroup Structure on the Evolution of Networks: An Economic Model of Network Evolution
인접 그래프
- 인물 3
- 방법론 2
- 개념 2
- 주제 1
- 수록처 1
- 분류 2
- 논문 2