Impact of Energy Production Mix on Alternative Fuel Vehicle Adoption in Korea
문성호, 이종수, Hyunhong Choi, Jongroul Woo (2022) · transportation-research-part-d 105:103219 · DOI ↗
Battery EV (BEV) 와 Hydrogen FCV (HFCV) 의 연료 생산 mix (전력 generation mix / 수소 production mix) 가 소비자 채택 에 미치는 영향을 discrete-choice-experiment + 혼합 로짓 로 측정. N=1,042 한국 소비자, 6,144 obs. 재생-orient 전력 mix 의 BEV 는 현 mix 보다 MWTP +5.7M KRW (=USD 4,800) 높음, green hydrogen HFCV 는 grey 보다 MWTP +4.7M KRW. 2030 시나리오에서 BEV+HFCV 의 cleaner mix 전환 시 연간 신차 sales 기준 256K tons CO₂ (12.78%) 감축.
- RQ: AFV (BEV, HFCV) 의 연료 생산 mix (BEV: 현 전력 mix vs 재생 oriented mix; HFCV: grey vs green hydrogen) 가 (i) 소비자의 vehicle 채택 결정에 미치는 영향, (ii) 2030 시장 share 와 GHG 배출 reduction 에 미치는 영향
- 방법론: discrete-choice-experiment (5,120 가능 조합 → orthogonal fractional factorial 48 alt → 6 choice sets × 4 alt), 혼합 로짓 (normal/lognormal coefficient mix), halton-draws (2,000 draws) simulated MLE, well-to-wheel-analysis (Cetinkaya et al. 2012 LCA emission factors)
- 데이터: Gallup Korea 온라인 survey 2021-02 1-2 주, 20-69 세 N=1,042 (Male 53.2%, Female 46.8%; income > 5M KRW 42.9%), 6 choice sets × 4 alt = 6,144 obs
- 주요 발견: (i) Coefficient 평균: BEV-current 0.292*** (MWTP +4,979 KRW = USD 4,200), BEV-renewable 0.629*** (MWTP +10,729 KRW = USD 9,050), HFCV-grey -0.278*** (MWTP -4,740 KRW = USD -3,999), HFCV-green -0.087 (n.s.). (ii) Vehicle price RI 36.14%, fuel cost 21.97%, charging time 21.41%, fuel type 12.42%, accessibility 6.40%, drivable range 1.66%. (iii) Scenario 4 (BEV+HFCV 모두 cleaner): 2030 BEV share 5.93% → 20.81% (+250.7%), HFCV 0.72% → 2.12% (+194.7%), ICEV 93.35% → 77.07% (-17.43%). (iv) GHG 감축: Scenario 1 -128K tons (-6.39%), Scenario 4 -256K tons (-12.78%). (v) GHG emission factor (gCO₂/km): ICEV 191.59, BEV-current 85.67, BEV-renewable 60.95, HFCV-grey 80.81, HFCV-green 27.70.
- 시사점: (a) Korean 정부의 9차 전력 수급 계획 (2020→2030 재생 15.8% → 40.3%) + Hydrogen Economy Roadmap (green H₂ 전환) 의 환경 효과 정량 평가. (b) BEV cleaner electricity 가 HFCV cleaner hydrogen 보다 총 GHG 감축에 더 효과적 — 이유는 BEV 가 ICEV market share 를 잠식하는 효과 (HFCV 는 share 자체가 작음). (c) HFCV 의 cleaner hydrogen 자체는 HFCV 단위당 GHG 70% 감소 (BEV cleaner mix 는 30% 감소) — 비율 효과로는 hydrogen 정책 가치 높음. 정책 함의: hydrogen portfolio standard, 청정 hydrogen 의무 비율 입법 필요.
요약
이 paper 는 이종수 의 consumer preference 라인 (2010-2025) 의 AFV 환경 확장이다. 기존 AFV 채택 연구 (Achtnicht 2011, Hackbarth & Madlener 2013, Tanaka et al. 2014, Byun et al. 2018, Moon et al. 2018, Shin et al. 2019, Khan et al. 2020, Kim et al. 2020) 는 vehicle attribute (price, range, charging time, CO₂ rate) 만 다뤘다. Energy production mix 자체를 attribute 로 도입한 직접 선행은 Choi et al. (2018 Energy Policy) 의 BEV electricity mix 분석뿐인데, 본 paper 는 (i) BEV + HFCV 양쪽 production mix 를 동시 고려, (ii) well-to-wheel-analysis (WTW) 결합으로 2030 시장 share × per-km GHG factor × 연간 sales × 연간 mileage 의 end-to-end 평가, (iii) Korean Hydrogen Economy Roadmap + 9th Basic Plan for Electricity Supply 의 ex-ante 정책 시뮬레이션을 결합한다.
방법론은 5 개 main attribute (fuel type 5 levels, charging time 4, fuel cost 4, accessibility 4, drivable range 4, vehicle price 4) → 5,120 가능 조합 → orthogonal fractional factorial 로 48 alt 추출 → 각 응답자에 6 choice set × 4 alt = 24 alt 노출. Coefficient distribution: vehicle type dummies 는 normal (선호 방향이 개인별 다름), continuous attributes 는 lognormal (모든 응답자가 same direction). Bhat (2001) + Train (2009) 의 halton-draws 2,000 draws 로 closed-form 부재 likelihood 의 simulated MLE 추정. MWTP = , Relative Importance = part-worth normalized.
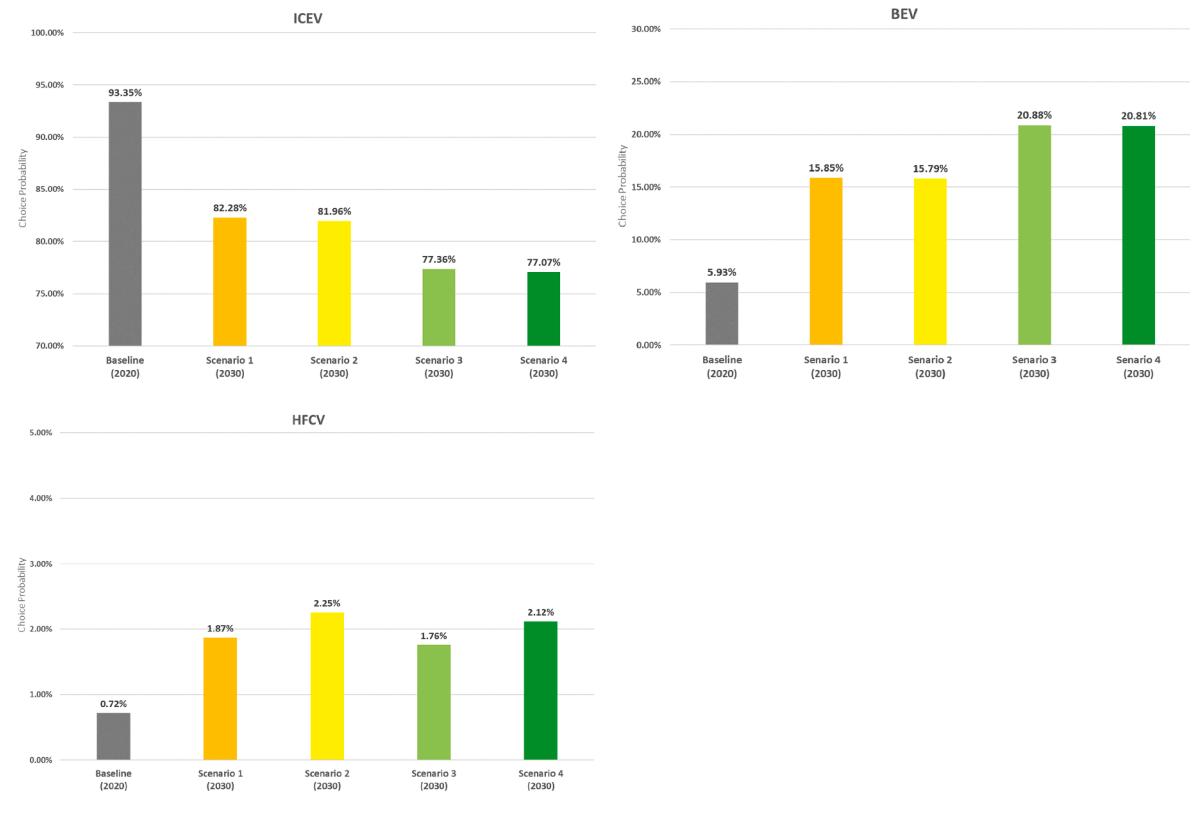
추정 결과의 핵심은 재생-oriented BEV 와 green-hydrogen HFCV 에 대한 한국 소비자의 명시적 환경 프리미엄. ICEV baseline 대비 BEV-renewable 의 MWTP 가 +9,050 USD, green-HFCV 는 ICEV 와 무차이 (n.s.) 인데, 이는 grey-HFCV (-3,999 USD) 의 부담을 cleaner hydrogen 으로 완전 상쇄 가능을 의미. Vehicle price 가 RI 36.14% 로 여전히 dominant (특히 charging time + fuel cost 가 각 ~21% 로 큰 영향). Scenario 분석은 4 조합 (cleaner BEV × cleaner HFCV) 으로 2030 시장 균형 시뮬레이션. BEV+HFCV 모두 cleaner 시 BEV share 5.93% → 20.81% (+250.7%), 이 share 잠식이 ICEV 의 -17.43% 와 GHG -12.78% (256K tons) 로 이어진다. WTW 비교에서 BEV cleaner mix 의 GHG 효과 (-180K) > HFCV cleaner mix 의 GHG 효과 (-100K) — 이는 BEV 가 ICEV share 를 잠식하는 효과가 크기 때문. HFCV 는 per-vehicle GHG 감축률 (70%) 이 BEV (30%) 보다 크지만 market share 자체가 작아 총 효과 제한.
핵심 결과
| Variable | Mean | Std. Dev. | MWTP | RI (%) |
|---|---|---|---|---|
| BEV-current power mix (vs ICEV) | 0.292*** | 1.319*** | KRW 4.98M = USD 4,200 | 12.42 |
| BEV-renewable power mix | 0.629*** | 1.408*** | KRW 10.73M = USD 9,050 | (in fuel type RI) |
| HFCV-grey hydrogen | -0.278*** | 1.174*** | KRW -4.74M = USD -3,999 | (in fuel type RI) |
| HFCV-green hydrogen | -0.087 | 1.448*** | n.s. | (in fuel type RI) |
| Charging time (100 min) | -2.843*** | 6.999*** | -USD 409/min | 21.41 |
| Fuel cost (100 KRW/km) | -1.284*** | 6.831*** | -USD 185/(KRW/km) | 21.97 |
| Charging accessibility (100%) | 0.519*** | 0.891*** | USD 75/%p | 6.40 |
| Drivable range (100 km) | 0.020*** | 0.016 | USD 3/km | 1.66 |
| Vehicle price (1M KRW) | -0.587*** | 1.389*** | — | 36.14 |
Choice probability by 2030 scenario:
| Fuel | Baseline (2020) | Sc 1 (orig) | Sc 2 (green H) | Sc 3 (clean elec) | Sc 4 (both) |
|---|---|---|---|---|---|
| ICEV | 93.35% | 82.28% (-11.86%) | 81.96% (-12.20%) | 77.36% (-17.13%) | 77.07% (-17.43%) |
| BEV | 5.93% | 15.85% (+167.22%) | 15.79% (+166.17%) | 20.88% (+252.00%) | 20.81% (+250.70%) |
| HFCV | 0.72% | 1.87% (+159.81%) | 2.25% (+213.35%) | 1.76% (+144.23%) | 2.12% (+194.71%) |
Net GHG change vs baseline (annual new-car sales):
| Scenario | Net Δ GHG (tons CO₂) | % change |
|---|---|---|
| Sc 1 (no mix change) | -127,996 | -6.39% |
| Sc 2 (cleaner H₂) | -144,915 | -7.23% |
| Sc 3 (cleaner elec) | -240,631 | -12.00% |
| Sc 4 (both cleaner) | -256,112 | -12.78% |
방법론 노트
혼합 로짓 utility:
는 iid Type I extreme value. Choice probability:
Closed-form 부재 → simulated probability:
은 에서 추출한 R 번째 draw. halton-draws (Bhat 2001) 가 random draws 보다 적은 수 (2,000) 로 더 정확한 integration. MWTP:
Scenario 분석은 (i) Train (2009) 의 alternative-specific constant calibration: 으로 estimated choice probability 를 actual market share 와 매칭, (ii) well-to-wheel-analysis: — emission factor (gCO₂/km, Cetinkaya 2012) × 연간 sales (~896K mid-/sub-compact 2020) × 선택 확률 × 연간 mileage (12,118 km/year).
연구 계보
본 paper 는 (a) discrete-choice-experiment + 혼합 로짓 의 McFadden-Train 전통, (b) Choi et al. (2018 Energy Policy) 의 BEV electricity mix 직접 선행, (c) Woo et al. (2017 TRD) 의 70-country BEV WTW 분석, (d) Kim et al. (2020 Applied Energy) 의 한국 BEV+HFCV dynamic GHG 분석, (e) Shin et al. (2019 TFSC) 의 multi-DC extreme value method 분석, (f) Cetinkaya et al. (2012) 의 hydrogen production LCA, (g) Korean 정부의 9th Basic Plan for Long-term Electricity Supply (2020) + Hydrogen Economy Roadmap (2019) 을 결합한다. TEMEP 내 sibling: 이종수 의 consumer preference 라인 의 EV/AFV 갈래 (Byun et al. 2018, Moon et al. 2018, Kim et al. 2020). 후속 Policy Designs to Increase Public and Local Acceptance for Energy Transition in South Korea (energy transition acceptance) 와 Analysis on the Acceptance of Coal Phase-Out Policy Considering Public Preferences: Policy Implications and Future Direction Based on Empirical Evidence from South Korea (coal phase-out) 가 sungho-moon × jongsulee 협업 라인의 환경 정책 확장.
See also
- 이종수
- 문성호
- Hyunhong Choi
- Jongroul Woo
- 혼합 로짓
- discrete-choice-experiment
- well-to-wheel-analysis
- 대체연료차
- green-hydrogen
- ghg-emissions
- transportation-research-part-d
- Policy Designs to Increase Public and Local Acceptance for Energy Transition in South Korea
- Analysis on the Acceptance of Coal Phase-Out Policy Considering Public Preferences: Policy Implications and Future Direction Based on Empirical Evidence from South Korea
인접 그래프
- 인물 4
- 방법론 1
- 주제 1
- 수록처 1
- 분류 1
- 논문 2