Measuring the Role of Technology-Push and Demand-Pull in the Dynamic Development of the Semiconductor Industry: The Case of the Global DRAM Market
Wonjoon Kim, 이정동 (2009) · Journal of Applied Economics 12(1):83–108 · DOI ↗
Schumpeter (1934) 이후의 technology-push vs demand-pull 의 source of innovation 논쟁을 integrated model 로 해결. differentiated product 의 기술혁신 Nash 균형 (NETI) (NETI) 위에서 두 sources 의 L-type curve — 기술 life cycle 초기에 technology-push > demand-pull, 후기에 reversed — 을 이론적·실증적으로 입증. 글로벌 DRAM 시장의 7 generation (4K → 16M) 패널로 검증. 핵심 정량 결과: memory density coefficient (α_j) 가 4K 의 +718.3*** 에서 16M 의 −0.27*** 로 generation 진화 따라 감소, price coefficient (β_j) 의 절대값은 증가 — 즉 기술 saturation 으로 consumer 가 기술 추가 가치보다 가격 에 민감해진다. Γ curve (technology-push − demand-pull) 가 모든 DRAM generation 에서 L-type 패턴 확인. 정책 함의: 정부의 supply-push 일변도 R&D 가 후기 단계에서는 비효율 — demand-pull 정책 (commercialization 지원, market formation) 필요.
- RQ: Technology-push 와 demand-pull 의 source of technological innovation 의 상대 중요도가 기술 life cycle 위에서 어떻게 동적 으로 변하며, 이를 integrated equilibrium model 로 어떻게 표현할 수 있는가?
- 방법론: 차별제품 분석 (Anderson-de Palma-Thisse 1992) 위 기술혁신 Nash 균형 (NETI) (NETI, subgame perfect, n-firm 비협력 게임); MNL 수요 모형 (Berry 1994 의 Berry (1994) 역행렬 절차 으로 unobserved product characteristics 처리, OLS by-generation); 첫 기술 saturation 매개변수 η ∈ (0, 1] 의 정량 식별
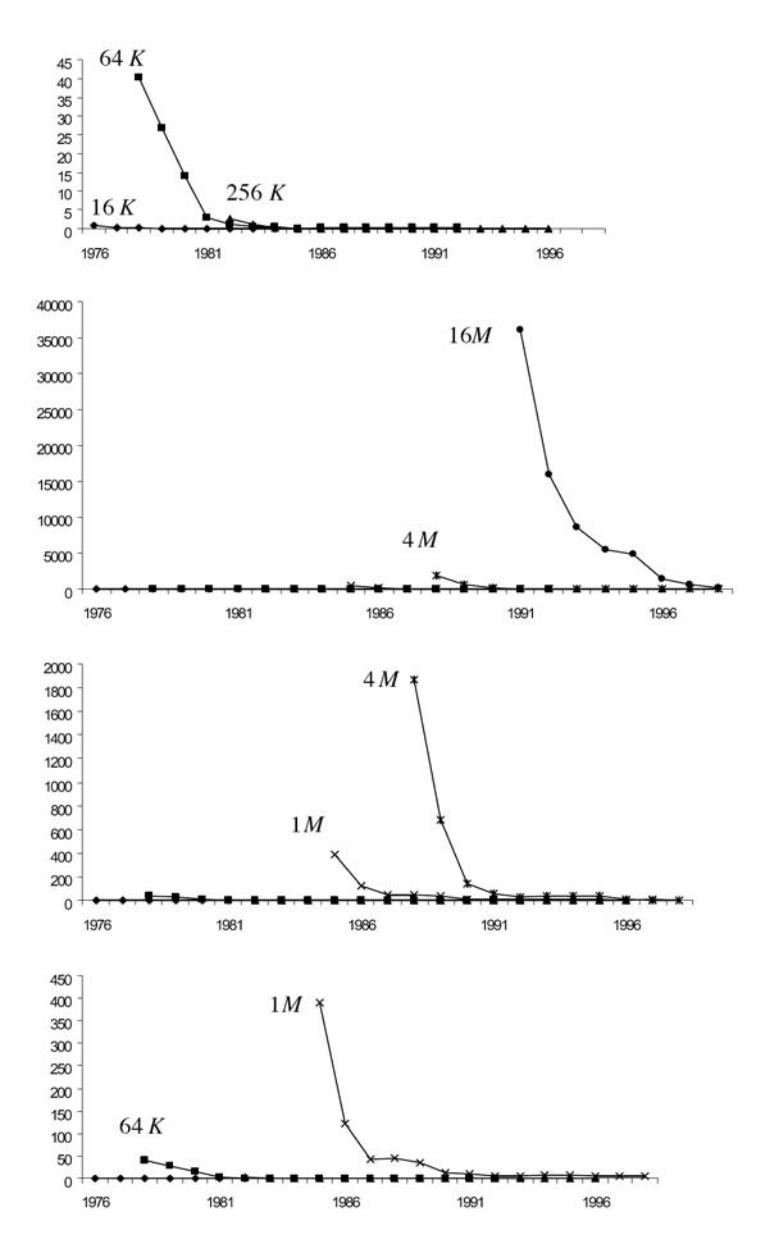
- 데이터: 글로벌 DRAM 시장 panel, 7 generation (4K, 16K, 64K, 256K, 1M, 4M, 16M), unit sales · 평균 가격 · memory density · age 의 generation별 시계열. Cahners In-Stat Group, market share 데이터 외부
- 주요 발견: (i) α_j (memory density coefficient) 의 generation 진화 — 4K +718.3*** → 16K +40.2 → 64K −3.1 → 256K −9.3 → 1M −1.4 → 4M −0.89*** → 16M −0.27*** (감소·역전). (ii) β_j (price coefficient) 의 절대값 generation 진화 — 4K −0.001*** → 16M −0.389** (절대값 증가). (iii) F-test 의 parameter homogeneity 강기각 (F=51.95, critical 2.10). (iv) Γ = TP − DP 의 L-type curve 가 6 generations (16K–16M) 모두에서 일관 — 초기 TP dominant, 후기 DP dominant. (v) 1998 후 DRAM 산업의 consolidation (Top 4 점유 71.6%) 와 함께 technology-push 강도 가 후속 generation 에서 magnified
- 시사점: (i) 학술적 — Schumpeter 이후 50 년 논쟁의 integrated answer: TP/DP 가 둘 다 필수, 상대 중요도는 L-type curve 로 시점 dependent. (ii) 기업 전략 — 초기 product innovation focus, 후기 process innovation (cost down) focus. (iii) 정책 — 정부의 supply-push 일변도 R&D 가 후기 비효율, demand-pull 정책 (commercialization 지원, 공공재 시장 형성) 필요. 특히 energy · 환경 · 통신 같은 public goods 시장 의 market failure 보정 leverage
요약
Schumpeter (1934) 이후 source of technical change 의 논쟁: (i) Griliches (1957) · Schmookler (1962, 1966) 의 demand-pull 가설 — 시장 수요가 발명을 유도; (ii) 이에 대한 technology-push 반론 — Mowery-Rosenberg (1979), Walsh (1984), Scherer (1982) 의 supply-side knowledge accumulation 의 push. Lucas (1967), Ben-Zion-Ruttan (1978), Ruttan (1997, 2001) 의 intermediate consensus — 둘 다 중요, 그러나 integrated empirical model 부재. 본 paper 의 motivation 은 이 50 년 논쟁의 unsolved questions — (i) 두 sources 의 상대 중요도가 시점에 따라 어떻게 변하는가, (ii) 후기 기술 life cycle 에서 lock-in escape 메커니즘, (iii) evolutionary economics (Arrow 1995) 의 가설을 empirical test 한 사례 부재 — 의 integrated 해결.
이론 모형: Anderson-de Palma-Thisse (1992) 의 차별제품 분석 framework. Demand-side — 소비자 quality perception ( = 제품 attribute level, = decreasing marginal utility 매개변수, technology saturation 의 측정). 작을수록 추가 기술 innovation 의 효용 감소가 빠름. 소비자 conditional indirect utility . MNL 수요 모형 로 product 의 시장 점유 도출. Supply-side — 각 firm 이 quality + price 선택, marginal cost (, = innovation capability). N-firm 비협력 게임의 기술혁신 Nash 균형 (NETI) (NETI) — 2-stage: (1) quality 선택, (2) price 선택. subgame perfect equilibrium 의 first-order condition 으로 technology-push (TP) 와 demand-pull (DP) 의 두 인자가 equilibrium quality 결정에 어떻게 들어가는지 명시.
Proposition 3 (Γ curve): TP − DP 의 차이 Γ 가 L-type — 초기 stage 에서 TP > DP (Γ > 0), 후기에서 TP < DP (Γ < 0 또는 0 근방). 이 hypothesis 의 정량 검증이 paper 의 핵심.
실증: 글로벌 DRAM 시장 panel. 7 generation (4K, 16K, 64K, 256K, 1M, 4M, 16M) 각각의 unit sales · 평균 가격 · memory density · age 시계열. Berry (1994) 의 Berry (1994) 역행렬 절차 으로 market share 의 unobserved product characteristics 문제 회피, 의 linear 형태로 OLS by-generation 추정.
결과:
- F-test 의 parameter homogeneity 강기각 (F=51.95, critical 2.10): generation 별 coefficient 가 다르다 는 통계적 evidence — fixed-coefficient 모형 부적합.
- Memory density coefficient α_j 의 generation 진화 — 4K +718.3*** (양·큰값) → 16K +40.2 (n.s.) → 64K −3.1 (n.s.) → 256K −9.3 (n.s.) → 1M −1.4 (n.s.) → 4M −0.89*** (음 유의) → 16M −0.27*** (음 유의). 즉 기술 saturation 패턴 — 4K 시점에서는 memory density 증가가 strongly demand 를 끌어내지만, 16M 시점에서는 오히려 음 (의외 결과는 다른 generation 과의 substitution 시그널).
- Price coefficient β_j 의 절대값 진화 — 4K −0.001*** (약) → 1M −0.057*** → 16M −0.389** (절대값 약 400 배 증가). 즉 가격 sensitivity 가 generation 진화에 따라 폭발적 증가.
- Γ curve (Fig. 6) — 6 generation (16K–16M) 모두에서 L-type 패턴 일관: 초기 Γ 양 (TP > DP), 후기 Γ 음 또는 0 근방 (DP ≥ TP). 256K 만 예외 — 1982–1985 의 강한 demand growth 가 TP 의 초기 dominance 를 약화.
- Consolidation effect — 1998 이후 DRAM 산업의 consolidation (Top 4 점유 71.6%, 2000년 기준) 와 동반해 후속 generation 의 초기 Γ peak 의 절대값 증가 — technology-push 가 더 강해진다. 이유: 시장 leaders (Micron · Samsung · Hynix · Infineon) 가 cost economies of scale 확보 위해 new generation 의 first-mover advantage 추구 → process innovation 의 supply-side 가속.
Policy implications:
- 정부의 R&D 정책은 기술 life cycle stage 에 따라 differentiated. 초기 stage 의 supply-push (basic research, R&D credit) + 후기 stage 의 demand-pull (commercialization 지원, market formation 보조금).
- Public goods 시장 (energy · 환경 · 통신) 의 commercialization 실패 보정에 demand-pull 정책 leverage 큼.
- DRAM 같은 fast-moving consumer technology 산업은 둘 다 동시 추구 필요.
한계: (i) Berry inversion 의 outside good 식별 가정 의 robustness, (ii) DRAM 시장 의 generation 전환의 외생성 가정 (실제로 firm strategic timing), (iii) Anderson-de Palma-Thisse framework 의 symmetric equilibrium 가정 의 firm heterogeneity 무시.
핵심 결과
Generation 별 MNL 추정 (Table 2, OLS by-generation)
| Gen | α_j (Memory Density) | β_j (Price) | γ_j (Age) | Adj R² |
|---|---|---|---|---|
| 4K | +718.31*** | −0.001*** | −0.822*** | 0.96 |
| 16K | +40.24 | −0.002*** | −0.358*** | 0.68 |
| 64K | −3.12 | −0.003*** | −0.289*** | 0.69 |
| 256K | −9.30 | −0.012*** | +0.079 | 0.83 |
| 1M | −1.39 | −0.057*** | −0.124 | 0.53 |
| 4M | −0.89*** | −0.046*** | +0.179 | 0.74 |
| 16M | −0.274*** | −0.389** | +0.407*** | 0.98 |
→ α_j 감소 (memory density 효과 약화) + |β_j| 증가 (가격 sensitivity 증가) = 기술 saturation 패턴.
F-test (parameter homogeneity): F = 51.95 > critical 2.10 (1%) → 강기각 → generation 별 coefficient 다름.
Γ curve 의 L-type 검증 (Fig. 6 요약)
| Generation | 초기 Γ (TP − DP) | 후기 Γ | 패턴 |
|---|---|---|---|
| 16K | + 큼 | ≈ 0 | L-type ✓ |
| 64K | + 큼 | − | L-type ✓ |
| 256K | + 약 (demand growth 예외) | − | L-type partial |
| 1M | + 큼 | − | L-type ✓ |
| 4M | + 매우 큼 | − | L-type ✓, 절대값 증가 |
| 16M | + 매우 큼 | − | L-type ✓, 절대값 증가 |
→ 후속 generation 에서 초기 TP peak 의 amplification — 1998 이후 consolidation 효과.
방법론 노트
Demand-side:
— quality perception (η ∈ (0, 1] = saturation 매개변수, η=1 이면 saturation 없음, η→0 이면 saturation 극대).
— conditional indirect utility.
Supply-side: firm 의 profit , marginal cost , = innovation capability.
기술혁신 Nash 균형 (NETI) (NETI, 2-stage subgame perfect):
- Stage 2 (given quality): price game 의 unique equilibrium (Anderson et al 1992 ch. 6 의 존재·유일성).
- Stage 1 (quality 선택): first-order condition from — technology-push (α η = demand-side marginal valuation) 와 demand-pull (β c’ = supply-side marginal cost) 의 balance.
Γ curve definition: — 두 source 의 순상대 강도. Proposition 3 의 L-type — 초기 Γ > 0, 후기 Γ < 0.
Empirical: Berry (1994) 의 inversion routine:
= outside good 의 시장 점유, = generation 점유. OLS by-generation (Kim et al 2003 의 SUR-like 절차).
식별은 (i) 7 generation × 시계열 의 panel variation, (ii) generation 간 기술 attribute (memory density) 의 cross-section variation, (iii) Berry inversion 의 outside good 가정에서 온다.
연구 계보
본 paper 의 technology-push vs demand-pull lineage 는 Schumpeter (1934) 이후 다음 라인:
- Demand-pull: Griliches (1957 Econometrica), Schmookler (1962, 1966 Invention and Economic Growth)
- Technology-push: Mowery-Rosenberg (1979 Research Policy), Walsh (1984 Research Policy), Scherer (1982 Research Policy)
- Intermediate: Lucas (1967 Journal of Political Economy), Ben-Zion-Ruttan (1978), Ruttan (1997 Journal of Economic Perspectives, 2001 Technology, Growth, and Development)
- Evolutionary: Arrow (1995), Arthur-Ermoliev-Kaniovski (1987)
Differentiated product equilibrium lineage: Anderson-de Palma-Thisse (1992 Discrete Choice Theory of Product Differentiation) — 본 paper 의 framework 의 핵심 source. Adner-Zemsky (2002, 2003 Management Science) — 기술 quality 의 decreasing marginal utility 가설. Utterback-Abernathy (1975), Porter (1983) 의 product innovation vs process innovation 분류.
Discrete choice estimation lineage: McFadden (1974) 의 conditional logit, Berry (1994 RAND Journal of Economics) 의 inversion routine, Berry-Levinsohn-Pakes (1995 Econometrica) 의 BLP 모형. 본 paper 의 Kim et al (2003, 2005) 의 한국 DRAM 분석 — sibling.
TEMEP 내 sibling cluster: (i) Demand forecasting for multigenerational products combining discrete choice and dynamics of diffusion under technological trajectories — 같은 저자의 한국 DRAM 다세대 demand forecasting (직접 sibling, MNL + Bass diffusion + Moore’s law). (ii) Forecasting future demand for large-screen television sets using conjoint analysis with diffusion model — TFSC 의 conjoint + diffusion + price function framework 의 paired sibling (TV market application). (iii) Demand forecasting for new technology with a short history in a competitive environment: the case of the home networking market in South Korea — Home Networking demand forecasting 의 dynamic utility framework sibling. 본 paper 는 기술경영경제정책전공 의 differentiated product 산업 경제 분석 라인의 이론·실증 통합 정점 — Anderson-de Palma-Thisse 의 표준 framework 위에 technology-push/demand-pull 의 dynamic balance 라는 새로운 시각 추가.
See also
- 차별제품 분석
- 기술혁신 Nash 균형 (NETI)
- MNL 수요 모형
- Berry (1994) 역행렬 절차
- Technology-push
- Demand-pull
- DRAM 시장
- 반도체 산업
- 기술 life cycle
- 기술 saturation
- L-type curve
- Demand forecasting for multigenerational products combining discrete choice and dynamics of diffusion under technological trajectories
- Forecasting future demand for large-screen television sets using conjoint analysis with diffusion model
- Demand forecasting for new technology with a short history in a competitive environment: the case of the home networking market in South Korea
- Wonjoon Kim
- 이정동
인접 그래프
- 인물 2
- 개관 1
- 방법론 4
- 개념 5
- 주제 2
- 수록처 1
- 분류 2
- 논문 3