Unveiling the Effect of Business Area Diversification: Does it Prevent or Promote the Corporate Efficiency of Biopharmaceutical Companies in Korea?
Jaehoon Yang, Eungdo Kim, 황준석 (2025) · Science, Technology and Society 30(1):76-98 · DOI ↗
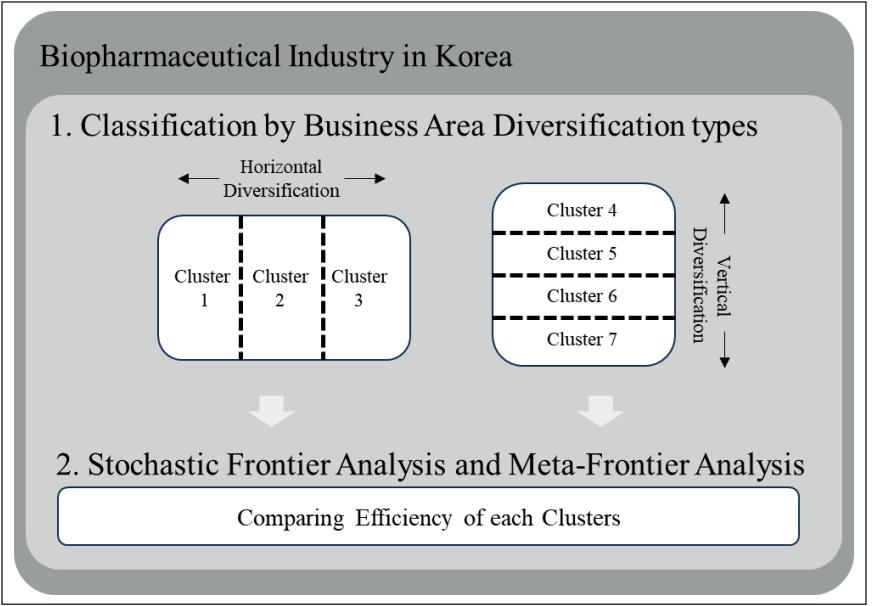
한국 바이오제약 기업의 사업 영역 다각화 (vertical: 가치사슬 상하 / horizontal: 동일 산업 내 신제품) 가 기업 효율성에 미치는 효과를 SFA (확률적 프론티어 분석) (SFA) + 메타프론티어 분석 로 검증. Korea Biotechnology Industry Association 의 178 firm, 1,830 obs (2015-2021) panel 사용. 4 vertical cluster (biochem/bioenergy · biofood · bioinstrument/bioequip · bioservice 로의 첫 진출 기준) 와 3 horizontal cluster (K-means, 동일 산업 내 sector 수 기반) 로 분류 후 Battese-Coelli (1995) translog SFA + Battese-Rao (2002) meta-frontier. 핵심 발견: bioinstrument/bioequipment 로 vertical 다각화한 cluster 가 TGR (Technology Gap Ratio) 0.794 로 최고 — meta-frontier 와 가장 가까워 highest potential. horizontal 측에서는 Cluster 7 (큰 portfolio 후 축소형, 2015 8.3 sector → 2021 3.8 sector) 이 TE 0.900 으로 최고.
- RQ: 한국 바이오제약 기업의 vertical / horizontal 사업 다각화는 기업 효율성을 향상시키는가, 저해하는가, 그리고 어떤 유형이 최적인가.
- 방법론: SFA (확률적 프론티어 분석) (Battese-Coelli 1995 time-varying), 메타프론티어 분석 (Battese-Rao 2002, QP/LP 추정), 트랜스로그 생산함수, K-평균 군집화 (horizontal 다각화 분류용), 패널 데이터 분석.
- 데이터: Korea Biotechnology Industry Association “Domestic Biotechnology Industry Survey”, 178 firm × 11 year subset = 1,830 obs (2015-2021). 변수 — output: log(Y) sales; input: log(K) asset, log(M) cost (R&D 포함), log(L) employee 수. Korean Bio-Industry Classification Code (8 sector: biopharma 10 / biochem-bioenergy 20 / biofood 30 / bioenv 40 / bioinstrument 50 / bioprocess 60 / bioresource 70 / bioservice 80).
- 주요 발견: (i) Vertical: 4 cluster — biochem (n=51, TE 0.856, TGR 0.493 최저), biofood (n=29, TGR 0.610), bioinstrument (n=41, TE 0.689, TGR 0.794 최고), bioservice (n=66, TGR 0.537). bioinstrument 다각화가 meta-frontier 와 가장 가까움. (ii) Horizontal: 3 cluster — 적정 유지 (n=127, TE 0.608), 무다각화 (n=29, TE 0.644), 큰 portfolio 후 축소 (n=11, TE 0.900 최고). 후자는 2015 평균 8.3 sector → 2021 3.8 sector 로 축소. (iii) 가설 H1 (vertical → 효율, 산업별 차이) 지지, H2 (horizontal 최적 수준 존재) 부분 지지 — 대기업의 초기 광범위 → 후기 집중이 효과적.
- 시사점: (a) 바이오제약 기업이 bioservice (CMO/CDMO) 보다 bioinstrument/bioequipment (biosensor, biomarker, ultrasound) 로 vertical 다각화 시 catch-up 잠재력 큼 — 한국 digital therapeutics / healthcare service 우세와 정합. (b) horizontal 다각화는 large firm 만 광범위 → 점진 집중 전략 유효.
요약
황준석 의 메타프론티어 분석 라인 (제2-3기의 핵심 방법론, Platform openness and the productivity of content providers: A meta-frontier analysis iOS-Android 플랫폼 효율성 등) 의 5기 바이오제약 응용. Jaehoon Yang 의 Advanced Institute of Convergence Technology + Eungdo Kim 의 Chungbuk National U Medicine 박사 라인이 황준석 의 산업 효율성 분석 라인과 결합한 작업. 같은 author group 의 직접 ancestor 는 황준석 author page anchor 의 “혁신과 기업 성과 — 다각화 전략” 라인 (Related and unrelated product diversification and collaboration strategies: Comparison between the pharmaceutical and biopharmaceutical industries 2022 JPIM) 의 연장. 한국 바이오제약은 미국·유럽 대비 150 년 격차를 좁히는 catch-up 노력 중 — Samsung Biologics (2015→2021 CAGR 64.7%) 와 Celltrion (CAGR 17.75%) 의 사례가 catch-up 가능성을 입증.
기존 다각화 연구는 두 흐름 — (a) 긍정 효과 (Markides 1997 risk 분산, Rumelt 1974 market dominance, Teece 1980 economies of scope), (b) 부정 효과 (Hoskisson & Hitt 1990 관리 복잡성, Lang & Stulz 1994 Tobin’s q 하락, Berger & Ofek 1995 financial 가치 훼손). 본 paper 의 차별점은 (i) 한국 바이오제약 특화 분석, (ii) vertical + horizontal 양 차원 비교, (iii) 메타프론티어 분석 로 cluster 간 technology gap 정량화. 의미상으로는 lee-malerba-2017-catch-up-cycles 의 sectoral catch-up framework 와 연결 — 바이오제약은 보통 catch-up 어려운 basic science-driven 산업인데, 한국이 specific diversification path (bioinstrument) 로 catch-up 진행 중임을 정량 확인.
핵심 발견 셋. 첫째, vertical 측에서 biochem cluster 는 TE 가 가장 높지만 (0.856) TGR 이 가장 낮다 (0.493) — 즉 group 내부 효율은 좋지만 산업 전체 frontier 와 격차 큼. 반대로 bioinstrument cluster 는 TE 0.689 (중간) 지만 TGR 0.794 로 최고 — meta-frontier 와 가장 가까워 industry leader 잠재력. 둘째, horizontal 측에서 Cluster 7 (큰 portfolio → 축소형 11 firm) 이 TE 0.900 으로 압도적 — Kahloul & Hallara (2010) 의 inverted-U “optimal intermediate level” 명제 지지. 셋째, bioservice (CMO/CDMO) 다각화가 의외로 우월하지 않음 — 한국 바이오제약의 catch-up 전략은 service 가 아니라 instrument 영역에서 더 promising. 한계: 외부 요인 (시장 성숙도, 정책) 미반영, 단일 country / 단일 industry 분석.
핵심 결과
Vertical Diversification (4 cluster, 첫 진출 산업 기준):
| Cluster | n | TE | TE* | TGR_QP | 해석 |
|---|---|---|---|---|---|
| 1 — Biochem/Bioenergy | 51 | 0.856 | 0.423 | 0.493 | TE 최고지만 meta-frontier 격차 큼 |
| 2 — Biofood | 29 | 0.683 | 0.403 | 0.610 | 추가 다각화 없음 |
| 3 — Bioinstrument/Bioequipment | 41 | 0.689 | 0.552 | 0.794 | meta-frontier 최근접 — catch-up 잠재력 최고 |
| 4 — Bioservice | 66 | 0.690 | 0.370 | 0.537 | 가장 많은 cluster 지만 차별성 없음 |
Horizontal Diversification (3 cluster, K-means):
| Cluster | n | TE | TE* | TGR_QP | 특징 |
|---|---|---|---|---|---|
| 5 — 적정 다각화 유지 | 127 | 0.608 | 0.4966 | 0.804 | 2015 3.0 → 2021 2.4 sector |
| 6 — 무다각화 | 29 | 0.644 | 0.519 | 0.803 | 특화 전략 |
| 7 — 큰 portfolio 후 축소 | 11 | 0.900 | 0.528 | 0.587 | 2015 8.3 → 2021 3.8 sector, TE 최고 |
- 핵심 메시지: bioinstrument 로 vertical 다각화 + 대규모 광범위 → 점진 집중의 horizontal 전략이 한국 바이오제약 catch-up 의 최적 조합.
- Samsung Biologics CAGR 64.7%, Celltrion CAGR 17.75% (2015-2021 revenue) 가 catch-up 성공 사례.
방법론 노트
SFA (확률적 프론티어 분석) (SFA, Battese & Coelli 1995 time-varying):
여기서 는 random error, 은 inefficiency. Technical Efficiency:
트랜스로그 생산함수 사용 (Cobb-Douglas 의 oversimplification 회피):
= K (자산), = M (R&D 비용), = L (종업원 수).
메타프론티어 분석 (Battese-Rao 2002, Battese-Rao-O’Donnell 2004) — 서로 다른 기술 (group) 간 TE 비교를 가능케 함. group 의 frontier 를 enveloping 하는 meta-frontier 추정:
이를 분해해 meta-frontier TE = group TE × TGR:
TGR 은 group 의 frontier 가 meta-frontier 에서 얼마나 떨어졌는지의 비율 (0~1, 1 에 가까울수록 catch-up 잠재력 큼).
추정은 LP (deviation 절댓값 최소화) 또는 QP (제곱 deviation 최소화) — 본 paper 는 QP 사용:
다각화 cluster 분류는 (i) vertical: Korea Bio-Industry Classification Code (4 자리) 의 앞 2 자리로 첫 진출 산업 분류, (ii) horizontal: 동일 산업 내 sector 수로 K-means clustering.
연구 계보
황준석 의 메타프론티어 분석 라인의 5기 (글로벌 의약 산업 catch-up) 응용. 직접 ancestor:
(i) 방법론 라인: 메타프론티어 분석 의 ICT 정책 적용은 Network neutrality and difference in efficiency among Internet application service providers: A meta-frontier analysis (Telecommunications Policy, 24 cit) 가 황준석 author page anchor 의 “효율성 분석” 라인 시작점. 이후 Platform openness and the productivity of content providers: A meta-frontier analysis (iOS vs Android 플랫폼, Telecommunications Policy, 36 cit), The influence of regulations on the efficiency of telecommunications operators: A meta-frontier analysis (통신사 규제 효율성) 으로 확장. 본 paper 는 그 방법론 라인의 바이오제약 응용.
(ii) 다각화 전략 라인: Related and unrelated product diversification and collaboration strategies: Comparison between the pharmaceutical and biopharmaceutical industries (Kim, Lee, Hwang & Kim 2022, JPIM, 14 cit) 의 related vs unrelated diversification 비교 — author page anchor 의 “혁신과 기업 성과” 라인의 직계 ancestor. External knowledge search, innovative performance and productivity in the Korean ICT sector (외부 지식 탐색의 역-U 효과) 의 “산업별 이질성 (heterogeneity)” 명제도 base.
(iii) catch-up 이론: Lee & Malerba (2017, Research Policy) 의 sectoral system catch-up cycles 가 본 paper 의 한국 바이오제약 catch-up framing 의 reference. Battese & Coelli (1995), Battese & Rao (2002), Battese, Rao & O’Donnell (2004, Journal of Productivity Analysis) 의 meta-frontier 시리즈가 method 측 핵심 reference. Yang & Kim (2024, Science Technology and Society) 의 한국 바이오제약 open innovation 분석이 같은 1 저자의 직전 작업.
See also
- 황준석
- Jaehoon Yang
- Eungdo Kim
- Science, Technology and Society
- SFA (확률적 프론티어 분석)
- 메타프론티어 분석
- Business Diversification
- Biopharmaceutical Industry
- Platform openness and the productivity of content providers: A meta-frontier analysis
- Network neutrality and difference in efficiency among Internet application service providers: A meta-frontier analysis
- Related and unrelated product diversification and collaboration strategies: Comparison between the pharmaceutical and biopharmaceutical industries
- The influence of regulations on the efficiency of telecommunications operators: A meta-frontier analysis
- External knowledge search, innovative performance and productivity in the Korean ICT sector
인접 그래프
- 인물 3
- 방법론 5
- 개념 1
- 주제 4
- 수록처 1
- 분류 1
- 논문 5