Profit, productivity, and price differential: an international performance comparison of the natural gas transportation industry
이정동, Sung-Bae Park, Tai-Yoo Kim (1999) · Energy Policy 27:679–689 · DOI ↗
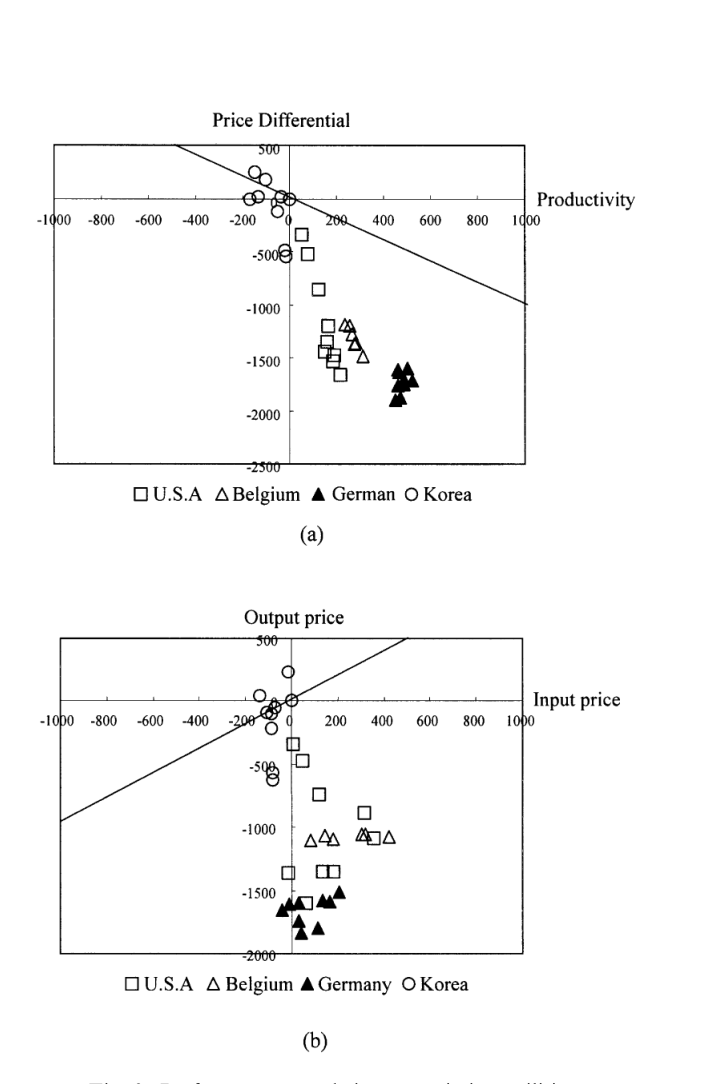
8 개국 (미국·캐나다·프랑스·이탈리아·벨기에·독일·일본·한국) 28 개 천연가스 송배관 사업자의 profit, productivity, price differential 을 edgeworth-index 로 단일 식에 통합해 multilateral 로 비교. 기술경영경제정책전공 천연가스 productivity 연구의 자매편으로 Productivity growth, capacity utilization, and technological progress in the natural gas industry 와 같은 sample period 를 공유하지만, 비용함수 추정이 아닌 수익·가격 차분의 absolute-value 비교 라는 점에서 보완적. 독일이 최고 생산성 + 최저 output price → 최저 profit (공익적으로 desirable), 한국 Kogas 는 LNG 의존 + 신생 단계로 낮은 productivity 지만 높은 output price 로 profit 유지.
- RQ: 천연가스 송배관 사업자의 profit / productivity / price differential 을 단일 framework 으로 어떻게 통합 비교할 수 있는가? 국가별·사업자별 성과 차이의 원인은?
- 방법론: edgeworth-index (input·output quantity 평균을 weight 로 가격·물량 차이를 absolute 가치로 표현), multilateral-comparison (Kogas 1995 를 base), profit-decomposition = productivity + price differential, ordinary-least-squares 보조 회귀
- 데이터: 8 개국 28 utilities (US 6, Canada 2, France 1, Italy 1, Belgium 1, Germany 1, Japan 14, Korea 1 — Kogas), 1987–1995 unbalanced panel, 1991 USD reference
- 주요 발견: profit 분해 결과 미국은 90 년대 deregulation 후 output price 급감 → profit 급락하지만 productivity 개선은 미미. 독일 (Ruhrgas) 은 highest productivity + lowest output price → lowest profit (공익적 모범). 한국 Kogas 는 infant stage + LNG 의존으로 productivity −75.5, 그러나 높은 output price 로 profit 흑자 영역 유지. OLS 회귀에서 utility size (β=0.464, t=7.07) 와 pipeline utilization (β=0.755, t=5.75) 가 productivity 의 dominant 결정 요인 (R²=0.972)
- 시사점: deregulation 의 productivity 효과는 자동이 아니다 — US 사례가 보여주듯 가격만 떨어지고 효율은 정체할 수 있음. 한국 같은 신흥 산업은 utility 규모 확대·marketing intensification 이 productivity 개선의 dominant lever
요약
1980 년대 중반 이후 OECD 천연가스 산업에서 liberalization·regulatory reform 이 본격화됐고, 그 효과를 정확히 평가하려면 profit, productivity, price differential 의 세 dimension 을 동시에 봐야 한다는 인식이 생겼다. 한 dimension 만 보면 — 가령 profit 만 보면 — 시장 지배력 (market power) 이 productivity 약점을 가릴 수 있다. 본 paper 는 Banker et al. (1996) strategy 문헌의 전통을 잇되, Edgeworth index 로 세 measure 를 absolute 가치 single equation 에 통합하고 multilateral panel 로 확장한 점이 핵심 기여.
방법론 핵심은 두 utility , 의 profit 차이를 input·output 의 평균 물량 을 weight 로 한 Edgeworth 가격·생산성 index 의 합으로 분해하는 것. 이를 임의의 base 사업자 (본 paper 는 Kogas 1995) 에 대해 모든 utility 에 일관되게 적용하면 unbalanced panel 에서도 작동하는 multilateral index 가 만들어진다. 송배관 (transmission) 결과 (Table 2): 1987–1995 평균 미국은 productivity 가 Kogas 대비 +146.0 (M$) 우수하지만 output price 가 −1021.4 낮아 profit −1009.2; 독일은 productivity +479.1 (최고) 인데 output price −1657.8 (최저) 로 profit −1252.4 (최저). 한국 Kogas 는 productivity −75.5 (열위) 지만 output price −153.6 (높음) 로 profit 적정 수준. OLS 보조 회귀로 productivity 변동의 원인을 utility size, pipeline utilization, 사업자 dummy 로 설명 — utility-specific 효과가 매우 큰 (D5 US +316.7, D7 EU +263.0) 가운데 size 와 utilization 둘 다 양(+) 유의 (β=0.464, 0.755, R²=0.972).
본 paper 의 message 는 두 가지 정책적 함의 — (i) deregulation 의 productivity 효과는 자동이 아니다; 미국 사례에서 가격은 떨어지고 productivity 는 정체했다, (ii) 한국 같은 infant 산업은 monopolistic 구조 자체가 problem 아니라 utility size 확장·pipeline utilization 강화 가 productivity 의 dominant lever. 한계는 — Edgeworth index 는 level 차이 만 보여주므로 absolute level 의 정당화 (예: “왜 독일이 LNG-dependent Kogas 와 비교 가능한가”) 는 별도 논의 필요. capacity utilization, technological change 의 명시적 분해는 자매편 Productivity growth, capacity utilization, and technological progress in the natural gas industry 가 다룬다.
핵심 결과
Transmission utility 성과 비교 (Table 2, Kogas 1995 기준 1991 M$, 1987–1995 평균)
| 국가 | Profit () | Productivity () | Price diff () | Output price () | Input price () |
|---|---|---|---|---|---|
| USA | −1009.2 | +146.0 | −1155.2 | −1021.4 | +133.8 |
| Belgium | −1044.7 | +271.5 | −1316.2 | −1074.8 | +241.4 |
| Germany | −1252.4 | +479.1 | −1731.5 | −1657.8 | +73.7 |
| Korea (Kogas) | −153.8 | −75.5 | −78.3 | −153.6 | −75.4 |
음수 부호 = Kogas 1995 대비 우위 (e.g., 미국 productivity +146 = Kogas 보다 더 생산적).
Productivity 변동 OLS 회귀 (Table 3, R²=0.972)
| 변수 | 계수 | t |
|---|---|---|
| Constant | −391.05** | −24.10 |
| Pipeline utilization (10⁹ kcal/km) | +0.755** | 5.75 |
| Utility size (10⁹ kcal) | +0.464** | 7.07 |
| US utility dummies (D1–D6) | −70 ~ +317 | mixed sig |
| EU utility dummies (D7, D8) | +263, +257** | both ≥10 |
** p<0.01. utility-specific dummy 의 크기가 size·utilization 효과를 dominant 하게 압도 — productivity 의 가장 큰 이질성은 사업자 자체에서 옴.
방법론 노트
Edgeworth bilateral index 는 두 utility 의 가격 차이를 둘의 평균 물량 을 weight 로 한 absolute 값으로 표현한다. 예컨대 output price 차이는:
input price 차이 도 같은 형태. 그러면 profit 차이가 자동으로 productivity 와 price differential 의 합으로 분해된다:
식별은 (i) Edgeworth 의 물량 평균 가중치 가 base 와 무관해 두 utility 의 대칭성 보장, (ii) Kogas 1995 를 fixed base 로 잡고 multilateral 확장 → unbalanced panel 의 임의 두 시점·국가 페어를 비교 가능, (iii) 보조 OLS 회귀의 utility dummy 가 country·ownership 효과를 흡수해 size·utilization 의 partial 효과를 식별. 한계는 Edgeworth 가 level 차이 만 절대값으로 표현하므로 비율적 productivity ratio 가 필요한 분석엔 부적합.
연구 계보
본 paper 는 Banker et al. (1996 Strategic Management Journal) 의 telecom productivity 분해, Miller (1984), Kurosawa (1991) 의 strategy 문헌 전통 위에 Edgeworth (Diewert 1981) index 를 multilateral 로 확장한 응용. 자연가스 산업 productivity 선행 연구는 Aivazian et al. (1987 Energy Journal) US, Rushdi (1994) 호주, Price-Weyman-Jones (1996) UK, Kim-Lee (1995) / Lee-Kim (1997) Korea 등.
같은 1999 년에 같은 sample (천연가스 6/8 개국) 위에서 작동하는 자매편 Productivity growth, capacity utilization, and technological progress in the natural gas industry 와 동일 sample period · 동일 KEPCO/Kogas 데이터를 공유. cost-function 추정 (translog-cost-function) 은 자매편이, 가격·profit 의 multilateral 차분 분해는 본 paper 가 담당하는 분업 구조다.
See also
- edgeworth-index
- multilateral-comparison
- natural-gas-transportation
- regulatory-reform
- kogas
- Productivity growth, capacity utilization, and technological progress in the natural gas industry
- 이정동
- Tai-Yoo Kim
인접 그래프
- 인물 3
- 개관 1
- 방법론 1
- 수록처 2
- 분류 1
- 논문 7
이 문서를 가리키는 페이지
논문 (7)
- Estimation of the shadow prices of pollutants with production/environment inefficiency taken into account: a nonparametric directional distance function approach
- Ex-ante analysis of welfare change for a liberalization of the natural gas market
- International comparisons of productivity and its determinants in the natural gas industry
- Introduction to APPC-2018, a Special Issue of the Journal of Productivity Analysis, 'Novel Applications of Efficiency and Productivity Analyses in the Asia-Pacific Region'
- Introduction: Productivity, Efficiency, and Economic Growth in the Asia-Pacific Region
- Manufacturing Sector Productivity Growth in the Asia Pacific Region
- Productivity growth, capacity utilization, and technological progress in the natural gas industry