Productivity growth, capacity utilization, and technological progress in the natural gas industry
이정동, kyung-joon-oh, Tai-Yoo Kim (1999) · Utilities Policy 8:109–119 · DOI ↗
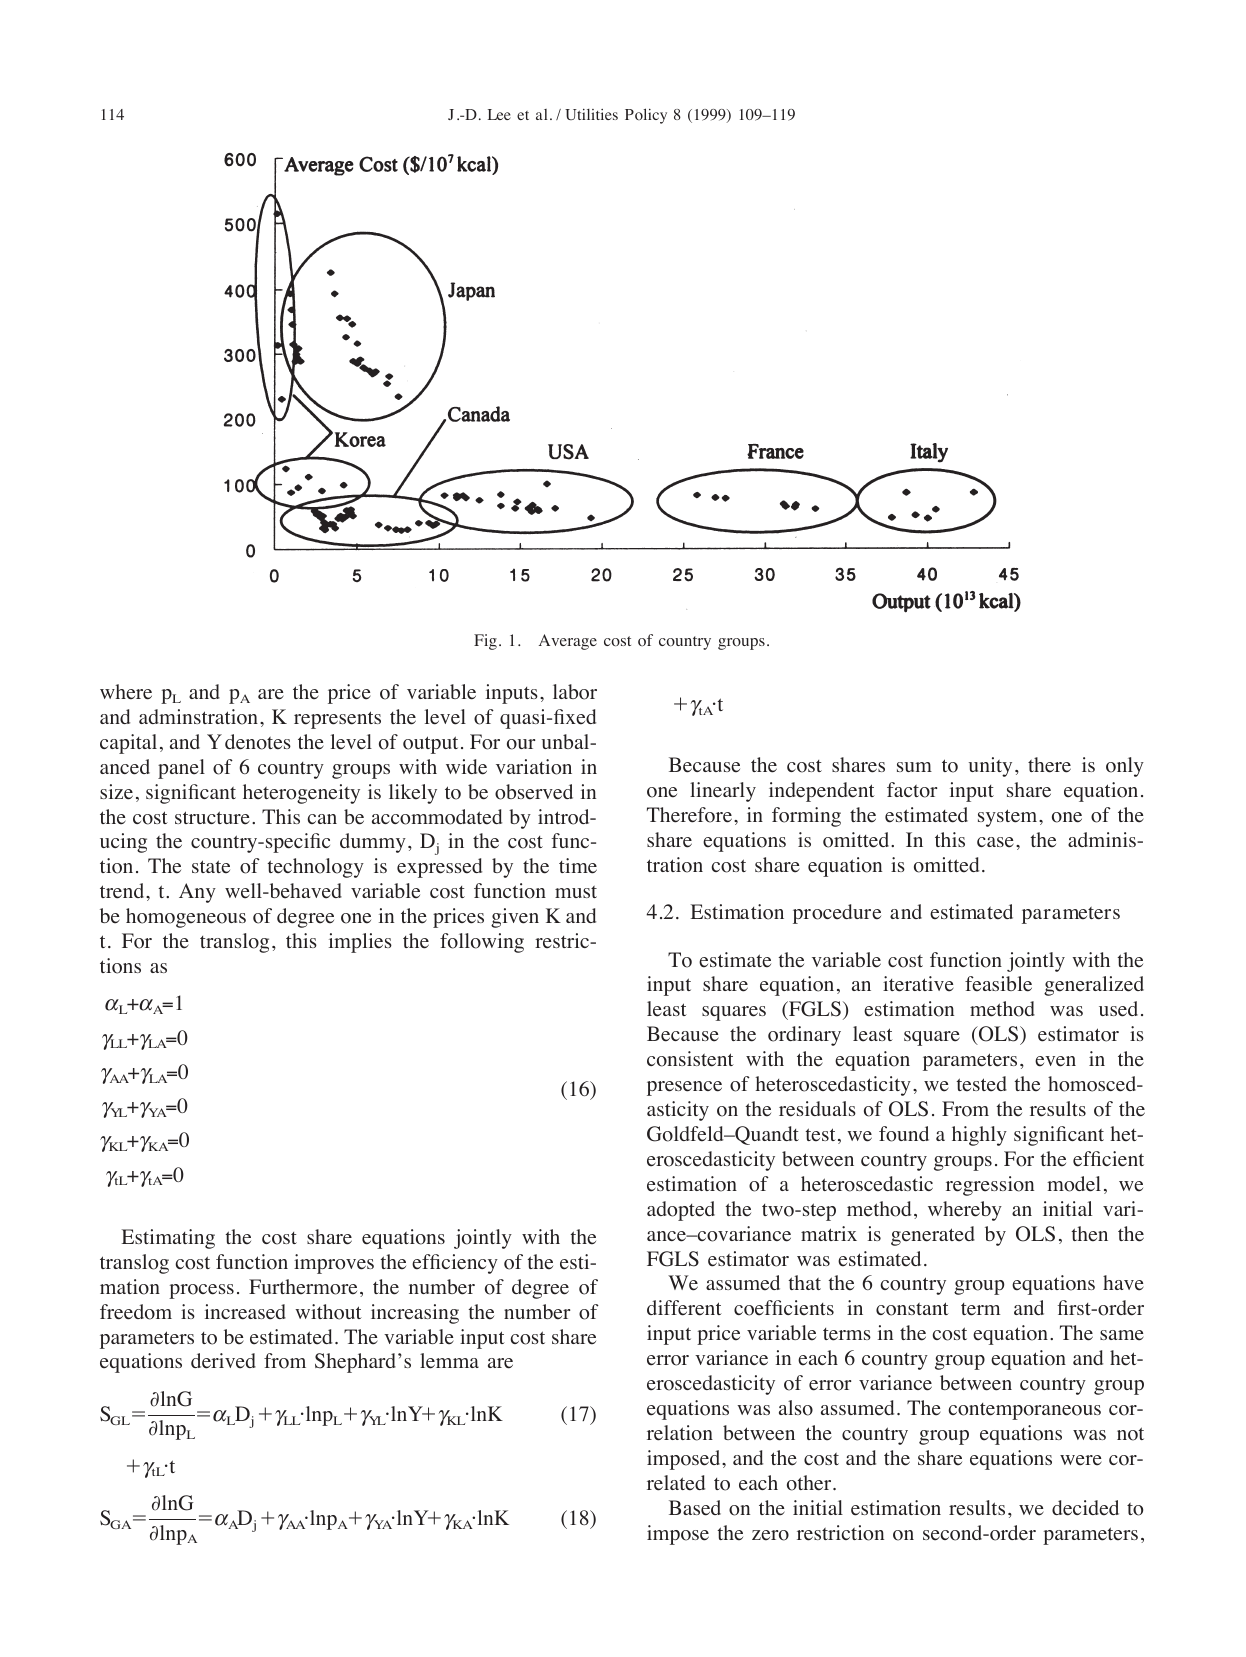
6 개국 (미국·캐나다·프랑스·이탈리아·일본·한국) 천연가스 산업의 TFP 성장을 short-run 변수 비용함수 (translog) 로 추정하고 scale economies, capacity utilization, technological change 세 요소로 분해한다. 한국의 TFP 성장률은 연 15% 로 압도적이지만 그 동력은 scale economies (+25.6%/year) 였고, 동시에 capacity utilization 악화 (-16.0%/year) 가 비용 증가 요인으로 작용. 성숙 산업 (미국 1.2%/y, 일본 5.1%/y, 프랑스 3.6%/y) 은 technological-change 가 dominant driver, 기술경영경제정책전공 의 에너지·산업 productivity 분해 연구의 첫 국제 비교 응용.
- RQ: 천연가스 산업의 TFP 성장은 scale economies, capacity utilization, technological change 중 어디서 오며 국가별 mature/premature 단계에 따라 어떻게 다른가?
- 방법론: translog-cost-function (short-run, quasi-fixed capital, NCRTS), feasible-generalized-least-squares, TFP 분해 (Morrison 1992 framework), short-run-equilibrium-model
- 데이터: 미국·캐나다·프랑스·이탈리아·일본·한국 6 country panel, unbalanced 104 obs, 1991 reference year, PPP-adjusted USD
- 주요 발견: TFPG/year — 한국 15.0%, 일본 5.1%, 프랑스 3.6%, 미국 1.2%, 캐나다 0.8%, 이탈리아 −2.5%. 한국은 scale +25.6 / CU −16.0 / tech +3.0; 성숙국은 tech change 가 dominant (US −4.5%, Italy −5.0%, France −4.8%, Japan −4.3% per annum)
- 시사점: 천연가스 같은 자본집약 산업의 productivity 정책은 (i) premature 단계엔 scale 확장이 dominant, (ii) 성숙 단계 진입 후엔 capacity utilization 와 tech change 가 결정. 한국 가스 산업의 1990 년대 capacity over-investment (전국 송배관망 확장) 가 cost 증가 요인이었음을 정량 확인
요약
1980 년대 후반 천연가스 산업의 deregulation·privatization 흐름 속에서 productivity 측정·분해는 정책 우선 과제가 됐다. 기존 연구 (Aivazian et al. 1987, Granderson-Linvill 1996) 는 scale economies 와 technological change 만 다뤘고 capacity utilization 을 별도 source 로 분리하지 않았다. 자본집약 산업에서 CU 의 sub-optimality 는 다른 productivity 약화 요인과 정책 처방이 다르므로 분리해야 한다. 본 paper 는 Morrison (1992) 의 short-run framework + Fuss-Waverman (1992) 의 international comparison 접근을 결합해 6 개국 천연가스 산업의 TFPG 를 세 요소로 분해한다.
방법론 핵심은 quasi-fixed capital , labor , administration 의 NCRTS translog-cost-function 을 country-specific dummy 와 함께 추정하는 것. unbalanced panel 104 obs 에 cost equation + share equation (admin share 제거) 시스템을 iterative FGLS 로 풀고, Durbin-Watson 결과에 따라 AR(1) 추가. 추정된 비용 elasticities () 로부터 TFPG 의 세 component (scale, CU, tech change) 를 분리. 결과 (Table 4) 가 보여주는 패턴은 분명하다 — 한국 (premature, TFPG 15%/y) 은 scale 확장 (+25.6) 과 CU 악화 (-16.0) 가 동시에 큰 반면, 성숙국 (미·일·불·이) 은 tech change 가 dominant (−4.3~−5.0%/y cost reduction).
본 paper 의 framework 은 이정동 의 frontier-based productivity 시리즈 (Technological Progress versus Efficiency Gain in Manufacturing Sectors) 와 자연스럽게 sibling 관계 — 1998 paper 가 nonparametric Malmquist 로 한국 제조업 cross-section 을 본 반면, 본 paper 는 parametric translog 로 international panel 을 본다. 한계는 명시적 — short-run framework 이라 capital 의 long-run 조정 동학을 포착하지 못하고, 한국의 1991 시점 후 deregulation 동학은 sample 범위 밖.
핵심 결과
TFPG 분해 (Table 4, 연 %)
| Country | TFPG | Scale economies | Capacity utilization | Tech change | Residual |
|---|---|---|---|---|---|
| Korea | 15.0 | +25.6 | −16.0 | +3.0 | +2.4 |
| Japan | 5.1 | +3.3 | −2.3 | +4.3 | −0.2 |
| France | 3.6 | +0.8 | −1.6 | +4.8 | −0.4 |
| US | 1.2 | +1.2 | −0.4 | +4.5 | −4.1 |
| Canada | 0.8 | +2.5 | −2.7 | +1.2 | −0.2 |
| Italy | −2.5 | +0.6 | −6.6 | +5.0 | −1.5 |
Cost elasticities (Table 3)
| Elasticity | US | Canada | France | Italy | Japan | Korea |
|---|---|---|---|---|---|---|
| Cost–output | 0.78 | 0.43 | 0.79 | 0.84 | 0.50 | 0.21 |
| Cost–capital | 0.58 | 0.55 | 0.59 | 0.78 | 0.54 | 0.58 |
| Cost–tech change | −0.045 | −0.012 | −0.048 | −0.050 | −0.043 | −0.027 |
모든 국가에서 → increasing returns to scale 존재. 한국이 가장 낮음 = scale 활용 여지 가장 큼. 모든 국가에서 → tech progress.
방법론 노트
Short-run framework 는 capital 을 quasi-fixed 로 두고 variable cost 만 최적화한다고 가정. Morrison (1992) 의 TFPG 분해는 비용 항등식의 로그 미분에서 출발:
여기서 는 cost-output·cost-capital·cost-tech-change elasticity, 는 variable input cost share. 이를 정리하면 TFPG 가 세 component 로 분해된다:
추정 모형은 NCRTS translog 에 country dummy 를 곱한 constant + first-order input price term, plus 표준 second-order term. 식별은 (i) 6 개국 unbalanced panel 에서 country-specific 비용 구조 heterogeneity 를 dummy 로 잡고, (ii) cost equation + variable input share equation 의 system 을 iterative FGLS 로 추정해 heteroskedasticity (Goldfeld-Quandt 기각) 와 autocorrelation (Durbin-Watson 신호 → AR(1)) 보정, (iii) 추정된 elasticities 를 mean data point 에서 평가해 분해 수치를 산출하는 데서 온다.
연구 계보
본 paper 는 Morrison (1986, 1992) 의 short-run framework 과 Fuss-Waverman (1992) 의 automobile industry international comparison 접근을 결합해 천연가스 산업에 응용. Aivazian et al. (1987 Energy Journal) 의 US 송배관 분석, Granderson-Linvill (1996 Resource and Energy Economics) 의 regulation impact 연구를 잇는다. Berndt-Hesse (1986) 의 translog 명세, Hall-Jorgenson (1967), Christensen-Jorgenson (1969) 의 user cost of capital 도 직접 사용.
이정동 의 productivity 시리즈에서 Technological Progress versus Efficiency Gain in Manufacturing Sectors 의 nonparametric Malmquist 자매편 — 1998 은 한국 제조업 cross-section, 본 paper 는 6 개국 panel × parametric translog. 같은 1999 년에 같은 데이터셋 핵심부를 공유하는 자매편 Profit, productivity, and price differential: an international performance comparison of the natural gas transportation industry (profit·productivity·price differential) 가 동시 출간됐다.
See also
- translog-cost-function
- TFP 분해
- natural-gas-industry
- capacity-utilization
- scale-economies
- Technological Progress versus Efficiency Gain in Manufacturing Sectors
- 이정동
- 허은녕
인접 그래프
- 인물 3
- 개관 1
- 방법론 1
- 수록처 2
- 분류 1
- 논문 12
이 문서를 가리키는 페이지
논문 (12)
- Estimation of the shadow prices of pollutants with production/environment inefficiency taken into account: a nonparametric directional distance function approach
- Ex-ante analysis of welfare change for a liberalization of the natural gas market
- Impact of R&D Intensity on the Firm Growth: Evidence from Korean Manufacturing Firms
- International comparisons of productivity and its determinants in the natural gas industry
- Introduction to APPC-2018, a Special Issue of the Journal of Productivity Analysis, 'Novel Applications of Efficiency and Productivity Analyses in the Asia-Pacific Region'
- Introduction: Productivity, Efficiency, and Economic Growth in the Asia-Pacific Region
- Manufacturing Sector Productivity Growth in the Asia Pacific Region
- Measuring consumption efficiency with utility theory and stochastic frontier analysis
- Profit, productivity, and price differential: an international performance comparison of the natural gas transportation industry
- Research and development linkages in a national innovation system: Factors affecting success and failure in Korea
- Technological Progress versus Efficiency Gain in Manufacturing Sectors
- The Measurement of Consumption Efficiency Considering the Discrete Choice of Consumers