Strategic Demand Forecasts for the Tablet PC Market Using the Bayesian Mixed Logit Model and Market Share Simulations
Jae Young Choi, Jungwoo Shin, 이종수 (2013) · behaviour-and-information-technology 32(11):1177-1190 · DOI ↗
iPad 와 Galaxy Tab 이 거의 동시 (2010 년 11 월 15 일/30 일) 출시된 한국 태블릿 PC 시장을 first-mover advantage 가 무력화된 pure 경쟁 환경으로 활용해, 500 명 (유효 389) conjoint 설문을 Bayesian 혼합 로짓 으로 분석. Screen size (RI 22.79%) + OS (20.62%) + applications 수 (18.52%) 가 가격 외 핵심 attribute. 핵심 발견: 현 기술 유지 시 iPad : Galaxy Tab = 80.28% : 19.72% 의 격차, 미래 다양화 시 iOS : Android = 51.32% : 48.68% 수렴. 6 시나리오 비교로 firm-level 전략 input 제공.
- RQ: (1) 태블릿 PC 시장에서 소비자가 가장 중시하는 attribute 는? (2) iPad vs Galaxy Tab 의 점유율 동학과, iPad 가격 인하·정의 향상·7” 출시·Android 앱 증가·Android 가격 인하의 6 시나리오 효과는?
- 방법론: 컨조인트 분석 (8 attribute, 864 → 16 fractional factorial, 4 choice sets × 4 alternatives), bayesian-mixed-logit (Gibbs sampling 20,000 iter, burn-in 10,000), market-share-simulation (Eq 6 sample enumeration)
- 데이터: 한국 서울·경기·인천 16-60 세 500 명 stated-preference 설문 (Dongseo Research, 2010-10 ~ 2010-12, 유효 389). 8 attribute: price, definition, storage, screen size, battery, applications, network type, OS
- 주요 발견: (1) RI: screen size 22.79% > OS 20.62% (iOS 9.42 + Android 11.20) > applications 18.52% > network 6.80% > price 8.38% > battery 7.84% > storage 8.52% > definition 6.52%. (2) Median MWTP: 스크린 1” 증가 288,094 won, 앱 10,000 개 증가 16,940 won, iOS premium 218,738 won. (3) 현 기술 saturation 시 iPad : Galaxy Tab = 80.28% : 19.72%. (4) Future 다양화 시나리오 (iPad 2 + Android 10 종) iOS : Android = 51.32% : 48.68%. (5) 7” iPad 출시 시 iOS 점유율 +8.5%p (51.32→59.83%). (6) Android 앱 수가 iPad 의 1/2 도달 시 Android 점유율 50% 돌파.
- 시사점: Apple 의 premium maintain 전략 vs Android 의 screen-size 다양화 + 앱 ecosystem 전략 의 trade-off 정량화. 한국 시장이 first-mover advantage 없는 pure competition 환경 으로 작용 — 글로벌 일반화 가능한 demand-side input.
요약
이 paper 는 이종수 의 1-2 기 전환점 (Bayesian DCM 의 ICT device 응용) 의 대표 작업으로, Ex-ante Simulation of Mobile TV Market Based on Consumers' Preference Data (mobile TV) → 본 paper (tablet PC) → Strategic Management of New Products: Ex-ante Simulation and Market Segmentation (전자결제 + segmentation) 의 Bayesian mixed logit + market simulation trilogy 의 가운데. 한국 태블릿 시장의 unique 경쟁 환경 — iPad 와 Galaxy Tab 이 거의 동시 (2010 년 11 월 15 일과 30 일) 출시돼 Apple 의 first-mover advantage 무력화 — 를 활용해, 글로벌 시장의 순수 경쟁 analog 으로 활용. 기존 태블릿 PC 연구는 교육 현장 사용성 또는 산업 보고서 만 있었고 consumer purchase behavior + market simulation 은 본 paper 가 최초.
방법은 bayesian-mixed-logit 의 표준 toolkit — Train (2003) + Train & Sonnier (2005) 의 bounded distribution 적용 (가격 log-normal negative, definition · storage · battery · network log-normal positive, screen · applications · OS dummy normal). Gibbs sampling 20,000 iter, burn-in 10,000, 매 10번째 draw 보존 → 1,000 retained b, 2,000 추가 draw 로 conditional distribution 도출. Equation (6) 의 sample enumeration of logit probability 로 시장 점유율 계산. 8 attribute: price (40/60/80 만원), definition (SD/HD), storage (16/32/64 GB), screen (7/9.7”), battery (4/10 hr), applications (5/20 만), network (WiFi/WiFi+3G), OS (iOS/Android/Etc).
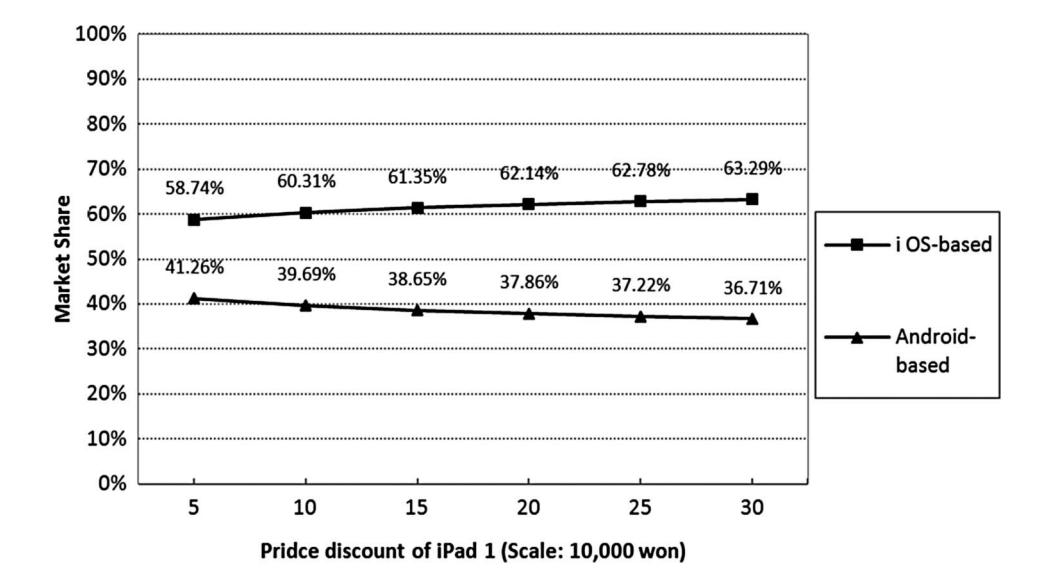
핵심 발견 (5 절): (1) Screen size RI = 22.79% — 가장 중요. Steve Jobs 의 “7” tablets are DOA” 발언이 정량 뒷받침. (2) OS RI 합 = 20.62%, iOS 가 Windows 대비 강한 premium, Android 는 비유의. iOS 의 자동 OS 업그레이드 (모든 iPad 버전 적용) + Apple UI 강점 (multi-touch, GUI 통합) 이 이유. (3) Number of applications RI = 18.52% — Gupta et al. (1999) 의 indirect network effect 가설 입증. 합 — screen + OS + applications = 61.93% (price 제외 전체 importance). (4) Median MWTP: 스크린 1” 증가 = 288,094 won, 앱 10,000 개 = 16,940 won, iOS premium = 218,738 won. (5) 시장 점유율 시뮬레이션 (case 1, future market base): 16 종 미래 제품 (iPad 2 × 6 + Android × 10) → iOS 51.32% / Android 48.68% — Android 의 screen size 다양성 (7”, 8.9”, 10.1”) 이 iPad 의 single 9.7” 를 상쇄. (6) Case 4 (Apple 이 7” iPad 추가 출시): iOS 51.32→59.83% (+8.5%p), Android 의 유일한 screen-size advantage 박탈. (7) Case 5 (Android 앱이 iPad 의 1/2 도달): Android 점유율 50%+ — 앱 ecosystem 이 hardware advantage 보다 강함. 시사점: Apple 의 strategic move 는 7” iPad 출시 + definition upgrade, Android 사업자의 strategic move 는 앱 마켓플레이스 활성화 (revenue sharing 정책).
핵심 결과
Mixed logit attribute 별 mean, RI, median MWTP (won):
| Attribute | Distribution | Mean β | RI (%) | Median MWTP |
|---|---|---|---|---|
| Price | log-normal | -0.5545** | 8.38 | — |
| Definition | log-normal | +2.3896** | 6.52 | 752,970 won/384,000 pixels |
| Storage capacity | log-normal | +0.0396** | 8.52 | 15,158 won/GB |
| Screen size | normal | +0.8222** | 22.79 | 288,094 won/inch |
| Battery | log-normal | +1.8872** | 7.84 | 96,012 won/hour |
| Number of applications | normal | +0.0754** | 18.52 | 16,940 won/10,000 apps |
| Network type (WiFi+3G) | log-normal | +7.2059** | 6.80 | 170,994 won |
| iOS | normal | +0.6852** | 9.42 | 218,738 won |
| Android | normal | +0.3215 (n.s.) | 11.20 | 35,616 won |
시장 시뮬레이션 (한국 시장, factory price):
| Scenario | iOS 점유율 | Android 점유율 |
|---|---|---|
| 2010 saturation (iPad vs Galaxy Tab only) | 80.28% | 19.72% |
| Case 1 base (iPad 2 + 10 Android 제품) | 51.32% | 48.68% |
| Case 2 (iPad 1 가격 300,000 won 인하) | +12%p (≈ 63%) | 37% |
| Case 3 (iPad 정의 4 배 향상) | 24.6% (iOS 1+2 합) | — |
| Case 4 (7” iPad 출시) | 59.83% | 40.17% |
| Case 5 (Android 앱 iPad 의 1/2 도달) | < 50% | > 50% |
| Case 6 (Android 가격 300,000 won 인하) | — | +7%p |
** p<0.01. N=389 응답자, $1 ≈ 1,117.75 won (2011-03).
방법론 노트
bayesian-mixed-logit — Train (2003) framework + Train & Sonnier (2005) bounded distribution. 핵심 design: attribute 별 coefficient 의 분포를 사전 정보로 constrain. Price (모두 싫음) → log-normal negative, definition/storage/battery/network (모두 좋음) → log-normal positive, screen/applications/OS dummy (방향 이질) → normal. 이는 normal 분포 가정 시 발생하는 일부 소비자가 비싼 가격 선호 의 unrealistic 결과 회피.
핵심 식 (utility + likelihood):
여기서 또는 (log-normal transformation), ∼ i.i.d. type-I extreme value. Likelihood for T-times choice:
추정: Gibbs sampling 20,000 iter, burn-in 10,000, retain 매 10번째 (1,000 draws), 추가 2,000 draws 로 conditional distribution. Market share simulation:
식별의 핵심: 한국 시장이 iPad 와 Galaxy Tab 거의 동시 출시 (Apple first-mover advantage 무력화) — 글로벌 시장의 pure competition analog 으로 작용해 brand momentum 효과를 control.
연구 계보
본 paper 는 (i) Train (2003) Cambridge UP 의 mixed logit + Bayesian 표준, (ii) Train & Sonnier (2005) Springer 의 bounded distribution, (iii) Allenby & Rossi (1999) JE 의 consumer heterogeneity Bayesian 모델, (iv) Gupta, Jain, Sawhney (1999) Marketing Science 의 indirect network externality 가설 (앱 수 = network size proxy), (v) Ex-ante Simulation of Mobile TV Market Based on Consumers' Preference Data (Jae Young Choi 의 mobile TV 분석) 의 method continuation, (vi) Lee, J.Y. Choi, Y. Cho (2011) IJCS 의 차세대 DVD 시장 분석 — 6 갈래의 종합. 이종수 author page anchor 의 Bayesian DCM 응용 시리즈 안에서, Ex-ante Simulation of Mobile TV Market Based on Consumers' Preference Data · Strategic Management of New Products: Ex-ante Simulation and Market Segmentation 의 sibling. Jungwoo Shin 의 TEMEP 박사논문 시리즈 (Impact of Electric Vehicles on Existing Car Usage: A Mixed Multiple Discrete-Continuous Extreme Value Model Approach 와 sibling).
See also
- 이종수
- Jae Young Choi
- Jungwoo Shin
- bayesian-mixed-logit
- 혼합 로짓
- 컨조인트 분석
- market-share-simulation
- ex-ante-policy-simulation
- tablet-pc
- ios-vs-android
- behaviour-and-information-technology
- Ex-ante Simulation of Mobile TV Market Based on Consumers' Preference Data
- Strategic Management of New Products: Ex-ante Simulation and Market Segmentation
- Impact of Electric Vehicles on Existing Car Usage: A Mixed Multiple Discrete-Continuous Extreme Value Model Approach
인접 그래프
- 인물 3
- 방법론 2
- 주제 1
- 분류 1
- 논문 3