Profitability and productivity changes in the Korean electricity industry
Won-Sik Hwang, 이정동 (2013) · Energy Policy 52:531-542 · DOI ↗
2001 년 한국전력공사 의 generation 부문이 6 개 발전자회사 (GENCOs) 로 분리된 전력산업 개혁 전후의 한국 전력산업 수익성을 자본 총요소생산성 (KTFP) 와 지수 기반 이익 분해 (INPD) 로 정량 분해한다. 개혁 전 (1994-2000) 의 이익 증가는 facility expansion 이 주도, 개혁 후 (2002-2008) 는 productivity growth 가 주도하지만 fuel 가격 급등이 그 효과를 상쇄해 owner 는 사실상 손실을 본다. 더 합리적인 wholesale·consumer 가격체계 정비가 민영화·deregulation 의 선결 조건이라는 정책 implications 를 도출한다.
- RQ: 한국 한국전력공사 의 2001 년 전력산업 개혁 전후 이익 변화 (수익성) 와 생산성 변화의 원천 분해 는 어떻게 되고, 그 surplus 이익이 어느 stakeholder (consumer · fuel supplier · employee · owner) 에게 어떻게 distributed 되었는가?
- 방법론: 지수 기반 이익 분해, Törnqvist 지수, 자본 총요소생산성, translog 항등식
- 데이터: KEPCO 의 Statistics of Electric Power in Korea (1994-2008, 개혁 전후 7+7년) + EPSIS 의 GENCO 수준 자료 (2002-2008, 6 개 GENCOs)
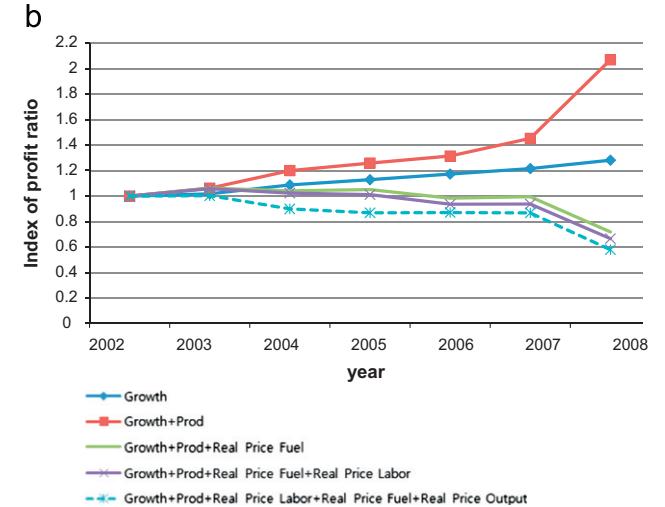
- 주요 발견: 개혁 전 KEPCO 의 이익은 facility 8.52%/year · productivity 4.52%/year 로 평균 7.09%/year 증가; 개혁 후엔 facility 4.24%/year · productivity 10.29%/year 이지만 fuel 가격 +14.20%/year 와 output 가격 통제 (−2.18%/year) 가 상쇄해 평균 −7.81%/year 손실. 6 개 GENCO 중 KOSEP (base-load 64.1%) 가 안정적이고 KOMIPO (general generator 의 LNG 의존) 가 가장 LNG 가격 sensitivity 큼 (−24.34%/year).
- 시사점: 민영화·deregulation 진행에 앞서 wholesale market 의 가격체계가 fuel 가격 변동을 반영해야 한다. 동시에 consumer 가격이 inflation 보다 낮게 규제되면서 KEPCO owner 가 만성 deficit, 그 부담을 정부가 떠받치는 구조 — 결과적으로 productivity 의 surplus 가 consumer 와 fuel supplier 에게 흘러간다.
요약
본 paper 는 이정동 의 자기 분류 제3기 성장의 역학과 거시적 전환 (2013-2019) 의 시작 지점 이자 에너지 정책의 심화 축의 출발점이다. 제1·2기 의 Malmquist 생산성 지수 · DEA 라인이 frontier-based productivity 추정 (sectoral · cross-country) 에 집중했다면, 본 paper 는 index-number 기반 productivity 분해를 단일 기업 (KEPCO) 의 시계열 + 6 개 자회사 cross-section 에 적용하면서 price effect 의 stakeholder distribution 까지 분해한다. 한국 전력산업의 2001 년 reform 이라는 natural experiment 를 활용해 reform 전후 7+7 년의 paired comparison 으로 reform 의 효과를 식별. 동시에 발전자회사 cross-section 의 fuel mix 분포가 LNG·anthracite·bituminous coal 가격 sensitivity 의 분산을 만든다 — KOSEP 의 base-load 64.1% vs KOMIPO 의 LNG 의존 의 paired contrast 가 핵심.
분석 framework 은 Lawrence et al. (2006) 의 Telstra 호주 telecom 적용 을 따라 Fisher (1922) 의 weak reversal test 와 Diewert–Morrison (1986) 의 translog 항등식 위에서 작동한다. 이익 index 로 분해하고 (productivity × price × growth), Törnqvist 지수 형식의 price·quantity index 를 사용한다. KTFP 의 핵심 통찰은 capital 만 fixed input 으로 두고 다른 inputs (labor · fuel · operation) 는 negative outputs 으로 처리한다는 점 — TFP 보다 productivity growth 가 상대적으로 크게 나오지만 (한 input factor 만 사용해서), capital-only proxy 로서 고정 facility 의 utilization 효율성 을 직접 측정한다. price index 를 fuel 별 (anthracite · bituminous coal · oil · LNG · nuclear · pumping-up) · consumer 별 (residential · public · industrial · educational · agricultural · street lighting) chained Törnqvist index 로 더 분해해 각 stakeholder 의 benefit share 를 monetary 단위로 계산한다.
본 paper 의 한계는 두 가지. 첫째, translog 항등식 의 constant returns to scale 가정 — 규제된 power generation 산업에서는 적합하지 않을 가능성. 둘째, INPD 가 productivity 와 efficiency 를 분리하지 못한다 (둘 다 fitness gap 으로 잡힘). 후속 Effects of regulation and economic environment on the electricity industry's competitiveness: A study based on OECD countries 가 OECD 28 개국 panel 로 country-comparison 의 축을 잡고, sibling Validation of an R&D-based computable general equilibrium model 가 연산일반균형 분석 라인의 R&D-extended 모델로 macro 차원의 productivity dynamics 를 다룬다 — 셋이 함께 이정동 제3기 의 에너지·CGE·regulation 라인을 형성.
핵심 결과
| 기간 | Growth (facility) | KTFP (productivity) | Real fuel price | Real output price | Net profit change |
|---|---|---|---|---|---|
| 개혁 전 (1995-2000 평균) | +8.52%/y | +4.52%/y | −0.10%/y | −0.17%/y | +7.09%/y |
| 개혁 후 (2003-2008 평균) | +4.24%/y | +10.29%/y | −14.20%/y | −2.18%/y | −7.81%/y |
stakeholder distribution (2002-2008 cumulative, million KRW 2008-price):
- 개혁 후 7 년간 KEPCO productivity dividend = 9,909,375 (2008 기준), 중 fuel supplier 15,261,453 · labor 589,168 · consumer 986,395 · owner −6,927,640
- 즉 productivity 의 surplus 가 fuel supplier 와 consumer 에게 흘러가고, owner 는 deficit 누적. KHNP (원자력) 만 모든 7 년 owner 가 흑자.
GENCO 별 LNG 가격 sensitivity (annual avg profit loss, ceteris paribus): KOMIPO −24.34%/y · KOSPO −14.12%/y · EWP −7.78%/y · KOSEP −5.82%/y · KHNP ~0%.
방법론 노트
지수 기반 이익 분해 의 출발은 이익 index 의 multiplicative 분해. Fisher (1922) 의 weak reversal test 로 profit index 를 price × quantity index 로 분리하고, 다시 quantity index 를 productivity × input growth 로 분리한다. Diewert–Morrison (1986) 의 translog 항등식 가 핵심: 기업이 translog profit function 을 갖고 profit maximization 으로 행동하면, productivity index 가 Törnqvist implicit netput quantity index ÷ Törnqvist input index 로 표현 가능.
핵심 식 (3 source 분해):
여기서 는 이익 growth index, 는 productivity index (Törnqvist quantity ÷ input), 는 Törnqvist price index, 는 input quantity index. Törnqvist price index 의 공식:
여기서 는 netput 의 profit share (variable input 은 negative output 으로 처리).
식별은 output price · 각 fuel price · labor price · operation price index 를 chained Törnqvist 형태로 분리 한 뒤, 각 price component 의 변화가 profit ratio 에 미치는 marginal 효과를 측정하는 데서 온다. 이를 monetary 단위로 cumulate 하면 stakeholder 별 benefit share 가 직접 도출된다. fixed input proxy 로는 installed generation capacity (kW) 를 사용 (Färe et al. 1990, Lam–Shiu 2004 등 전력산업 productivity 문헌의 표준).
연구 계보
본 paper 는 Lawrence et al. (2006) 의 Telstra 호주 telecom productivity decomposition, Fox et al. (2003) 의 British Columbia 수산업 fishery 비교, Tran et al. (2009) 의 value-added TFP 확장 라인을 잇는다. Diewert–Morrison (1986) 의 translog 항등식 와 Fisher (1922) 의 weak reversal test 가 이론적 토대. Caves et al. (1982) 의 translog productivity index, Färe et al. (1990) · Hiebert (2002) · Lam–Shiu (2004) · Whiteman (1999) 의 전력산업 productivity 연구가 가장 가까운 sector-level 선행 작업. 이정동 author page 의 제3기 에너지 정책의 심화 축의 시작 지점이며, Profitability Gains of Korean Defense Firms: Technological Progress or Cost Shifting? 의 방위산업 SFA 와 The relevance of DEA benchmarking information and the Least-Distance Measure 의 DEA benchmarking 이 sector-level productivity 분석의 같은 라인 sibling.
See also
- Effects of regulation and economic environment on the electricity industry's competitiveness: A study based on OECD countries
- Validation of an R&D-based computable general equilibrium model
- 이정동
- 지수 기반 이익 분해
- 자본 총요소생산성
- Törnqvist 지수
- translog 항등식
- 한국 전력산업
- 한국전력공사
- 전력산업 개혁
- Energy Policy
인접 그래프
- 인물 2
- 방법론 7
- 개념 2
- 주제 4
- 수록처 2
- 분류 1
- 논문 7
이 문서를 가리키는 페이지
논문 (5)
- A CGE analysis for quantitative evaluation of electricity market changes
- A new approach to measuring shadow price: Reconciling engineering and economic perspectives
- Assessing the Socio-Economic Effects of Korea's Nuclear Power Policy
- Effects of regulation and economic environment on the electricity industry's competitiveness: A study based on OECD countries
- Validation of an R&D-based computable general equilibrium model