International comparison of industrial CO2 emission trends and the energy efficiency paradox utilizing production-based decomposition
kyunam-kim, 김연배 (2012) · Energy Economics 34(6):1724–1741 · DOI ↗
43 개 국 (OECD 26 + non-OECD 17) 의 1990-2006 산업 CO₂ 배출 변화를 DEA + LMDI 분해 의 production-based decomposition 으로 분해. 6 driver 분해 — energy mix, potential energy intensity, structure, economic activity, technical efficiency, technological change (energy-saving technology). 마지막 2 driver 가 energy efficiency paradox (효율 잠재력에도 불구한 미달성) 의 정량 식별. 경제활동 (D_EATEF) 이 가장 큰 배출 증가 driver — OECD geometric mean 1.54, non-OECD 1.73. OECD 가 non-OECD 보다 production technology 더 효율 확산.
- RQ: 산업 CO₂ 배출 변화의 6 driver — energy mix, potential energy intensity, structure, economic activity, technical efficiency, technological change — 의 분해를 통해 (i) 각 driver 의 정량 기여, (ii) energy efficiency paradox 의 region-level 식별, (iii) 각 국의 CO₂ 감축 technical potential 추정?
- 방법론: DEA (Färe-Grosskopf-Lovell 1994 의 directional distance function) 으로 best-practice production frontier 구성 + technical efficiency vs technological change 분리, LMDI 분해 (Ang 2005 LMDI-I) 로 6 driver 분해, Malmquist 생산성 지수 의 inter-temporal frontier shift, potential CO₂ Intensity Index (PCII) 로 best practice 대비 gap 측정
- 데이터: 43 국 (OECD 26 + non-OECD 17) × 1990-2006. 산업 부문 CO₂ + energy use + value-added. 입력: capital, labor, energy by fuel type. 출력: industrial value-added (good output) + CO₂ (bad output)
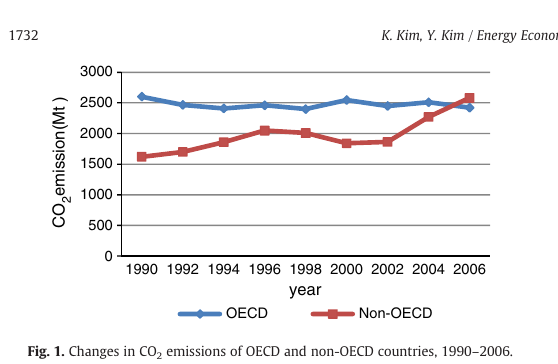
- 주요 발견: (i) OECD 총 산업 CO₂ −7% (2,600 → 2,421 Mt, 1990-2006), non-OECD +59% (1,621 → 2,580 Mt) — non-OECD 의 증가가 OECD 의 감소 압도. (ii) Economic activity (D_EATEF) 가 dominant — OECD geomean 1.54, non-OECD 1.73. China 3.96 가 single 가장 큰 증가 driver. (iii) Potential energy intensity (D_PEIEF) 가 대부분 국가에서 <1 (감소 기여) — energy decoupling from growth 인식과 일치, OECD geomean 0.65. (iv) Energy mix (D_EMXEF) 대부분 <1 (낮은-탄소 fuel 전환의 effect) — Canada, Korea 만 OECD 내 예외 (>1). (v) D_EUEEF (energy-usage efficiency) 와 D_ESTEF (energy-saving technology change) 의 mixed — OECD 의 northern·western Europe, Asia, N America 가 production technology efficient diffusion, eastern Europe·non-OECD 는 catch-up 미실현. (vi) PCII (best practice gap) — 시계열 감소 (gap closing) — OECD 가 non-OECD 보다 낮은 PCII (technological gap 더 작음).
- 시사점: (a) Energy efficiency paradox 의 region-specific: northern·western Europe·N America·OECD Asia 에서 paradox 가 less prevalent (potential 을 actual 로 변환), 나머지 region 은 catch-up 미실현. (b) Post-Kyoto 정책 함의: 신흥국 (China, India, Brazil) 의 generation-side energy mix 정책 (natural gas, renewable) 이 생산기술 효율 catch-up 보다 단기 효과 큼. (c) OECD 의 technological change leadership: D_ESTEF 가 northern Europe 만 <1 (감소 기여) — 대부분 region 에서 energy-saving 혁신 부족. 글로벌 R&D 협력 필요.
요약
본 paper 는 김연배 의 에너지-환경 라인의 방법론 핵심 작업 (author page 의 제2기 SNU-TEMEP 확장기 의 에너지-환경 정책 분기, 가장 인용 높은 작업 중 하나, 162회 인용). International comparison of CO2 emission trends in the iron and steel industry / CO2 Emission Trends in the Cement Industry: An International Comparison 의 physical indicator-based decomposition 의 한계 — technical efficiency vs technological change 미분리 — 를 DEA 결합으로 해결. 기존 index decomposition analysis (Ang 1995, 2005) 는 aggregate energy intensity 만 분해, production technology 의 efficient frontier 미포함. 본 paper 의 conceptual move 는 — DEA 의 best-practice production frontier + LMDI 의 additive decomposition 결합으로 production-based decomposition framework 구성, 6 driver 의 simultaneous identification.
방법론은 두 stage. (i) DEA frontier estimation — 각 country-year 에 대해 capital, labor, fuel-by-type input → value-added (good) + CO₂ (bad) output 의 directional distance function. Best-practice frontier 가 all-country-year 의 envelope (또는 역동적 frontier). (ii) LMDI-I (logarithmic mean Divisia index) 의 6-factor multiplicative decomposition:
여기서 (energy-usage efficiency) 는 frontier 와의 distance change (catch-up), (energy-saving technological change) 는 frontier 자체의 shift (innovation). Malmquist 생산성 지수 의 catch-up vs frontier-shift 분리와 동일 logic. Potential CO₂ Intensity Index (PCII) 가 actual / best-practice intensity 의 ratio — energy efficiency paradox 의 정량 indicator.
발견은 post-Kyoto 정책 prescription 의 정량 evidence 제공. (a) 6 driver 의 ranking: economic activity (>>) > potential energy intensity (<) > energy mix (<) > structure (≈1) > technical efficiency (mixed) > technological change (mixed). 즉 경제성장이 가장 강한 emission 압력, technology-related driver 가 가장 약한 mitigation force. (b) OECD vs non-OECD asymmetry: 모든 driver 의 OECD 값이 non-OECD 보다 mitigation-favorable — production technology 의 efficient diffusion gap 이 OECD-non-OECD 의 emission divergence 의 핵심. (c) Energy efficiency paradox 의 region-specific: northern·western Europe + OECD Asia + N America 에서 paradox 미발현 (potential 의 actual 전환), eastern Europe + non-OECD 는 catch-up 미실현. 한계: (i) 43 국 selection bias (small developing 국 부재), (ii) DEA frontier 의 single best-practice 가정 (heterogeneous technology 미반영), (iii) 1990-2006 의 Asian financial crisis (1997-98) 와 dot-com bust 의 break point 미반영, (iv) Industrial value-added 만 output — service sector·household 미포함.
핵심 결과
6 driver 의 OECD vs non-OECD geometric mean (Tables 3-4)
| Driver | OECD | non-OECD | 해석 |
|---|---|---|---|
| (총 변화) | 0.940 | 1.362 | OECD 감소, non-OECD 증가 |
| (energy mix) | 0.952 | 0.986 | 둘 다 mitigation 기여 |
| (potential energy intensity) | 0.647 | 0.727 | 가장 큰 mitigation driver |
| (structure) | 0.974 | 0.981 | 거의 무변화 |
| (economic activity) | 1.541 | 1.729 | 가장 큰 emission driver |
| (energy-usage efficiency) | 1.005 | 1.006 | mixed |
| (energy-saving tech change) | 1.011 | 1.011 | mixed |
정량 결론. (i) Economic activity 가 single dominant emission driver — non-OECD (1.73) 가 OECD (1.54) 보다 12% 더 큰 압력. (ii) Potential energy intensity 가 single largest mitigation — OECD (0.65) 가 non-OECD (0.73) 보다 12% 더 효과적. (iii) Production technology drivers () 가 1 근방 — technology 가 가장 약한 lever.
Country-level highlights
| 국가 | 특이 | |||
|---|---|---|---|---|
| China | 1.69 | 3.96 | 0.30 | 경제활동 가장 강, energy intensity 가장 큰 감소 |
| Korea | 1.31 | 2.21 | 0.54 | OECD 중 economic activity 둘째로 큼 |
| US | 0.90 | 1.62 | 0.59 | 평균보다 낮은 economic 압력 |
| Germany | 0.61 | 1.33 | 0.54 | OECD 중 best decarbonization |
| Brazil | 1.69 | 1.51 | — | energy mix (charcoal→gas) 의 emission 감소 catalyst |
방법론 노트
DEA 의 directional distance function 은 (good output 증가 + bad output 감소) 방향 distance 측정. Färe-Grosskopf (2003) 의 environmental DEA — bad output 의 weak disposability 가정. LMDI 분해 의 logarithmic mean Divisia index 는 zero-residual (가법적 정확 분해) 성질을 가짐.
핵심 식. CO₂ 배출 분해:
각 driver 의 LMDI 가중 평균:
여기서 logarithmic mean. DEA 의 directional distance:
여기서 = directional vector (good output 증가 + bad output 감소). Malmquist 생산성 지수 decomposition 으로 . 식별은 (i) 43 국 × 17 yr panel 의 sufficient frontier 추정, (ii) DEA LP 의 infeasibility 처리 (일부 국 제외), (iii) LMDI 의 zero residual 성질.
연구 계보
본 paper 는 (a) Färe-Grosskopf-Lovell (1994), Färe-Grosskopf (2003) 의 environmental DEA literature, (b) Ang (1995, 2005), Ang-Zhang (2000), Wang (2007) 의 LMDI decomposition literature, (c) Hashimoto-Haneda (2008), De Rassenfosse-van Pottelsberghe (2009) 의 DEA-based productivity decomposition 의 결합. CO2 Emission Trends in the Cement Industry: An International Comparison / International comparison of CO2 emission trends in the iron and steel industry 의 physical indicator decomposition 의 한계 — technical efficiency vs technological change 미분리 — 를 DEA frontier 결합으로 해결. Energy efficiency paradox (Jaffe-Stavins 1994) 의 region-specific 식별이 본 paper 의 distinctive contribution. 김연배 author page 의 제2기 (SNU-TEMEP 확장기) 의 에너지-환경 라인의 방법론 정점 (author page 분류). 이후 Role of policy in innovation and international trade of renewable energy technology: Empirical study of solar PV and wind power technology (RSER) 의 재생에너지 정책 + R&D + 무역 simultaneous 분석 으로 라인 확장. 기술경영경제정책전공 내 productivity decomposition 라인 (Technological Progress versus Efficiency Gain in Manufacturing Sectors, jeongdonglee-1999-natural-gas-productivity) 의 환경 차원 확장 위치.
See also
- DEA
- LMDI 분해
- production-based-decomposition
- Malmquist 생산성 지수
- energy-efficiency-paradox
- 기술적 효율성
- best-practice-frontier
- kyunam-kim
- 김연배
- International comparison of CO2 emission trends in the iron and steel industry
- CO2 Emission Trends in the Cement Industry: An International Comparison
- Role of policy in innovation and international trade of renewable energy technology: Empirical study of solar PV and wind power technology
- Energy Economics
인접 그래프
- 인물 1
- 개관 1
- 방법론 3
- 개념 1
- 주제 1
- 수록처 1
- 논문 7
이 문서를 가리키는 페이지
논문 (4)
- Corporate strategies to protect software innovation: Empirical evidences from South Korea
- Electricity-generation mix considering energy security and carbon emission mitigation: Case of Korea and Mongolia
- Role of policy in innovation and international trade of renewable energy technology: Empirical study of solar PV and wind power technology
- Strategic and economic behavior of a sued company in patent litigation