Technological Progress versus Efficiency Gain in Manufacturing Sectors
이정동, Tai-Yoo Kim, 허은녕 (1998) · Review of Development Economics 2(3):268–281 · DOI ↗
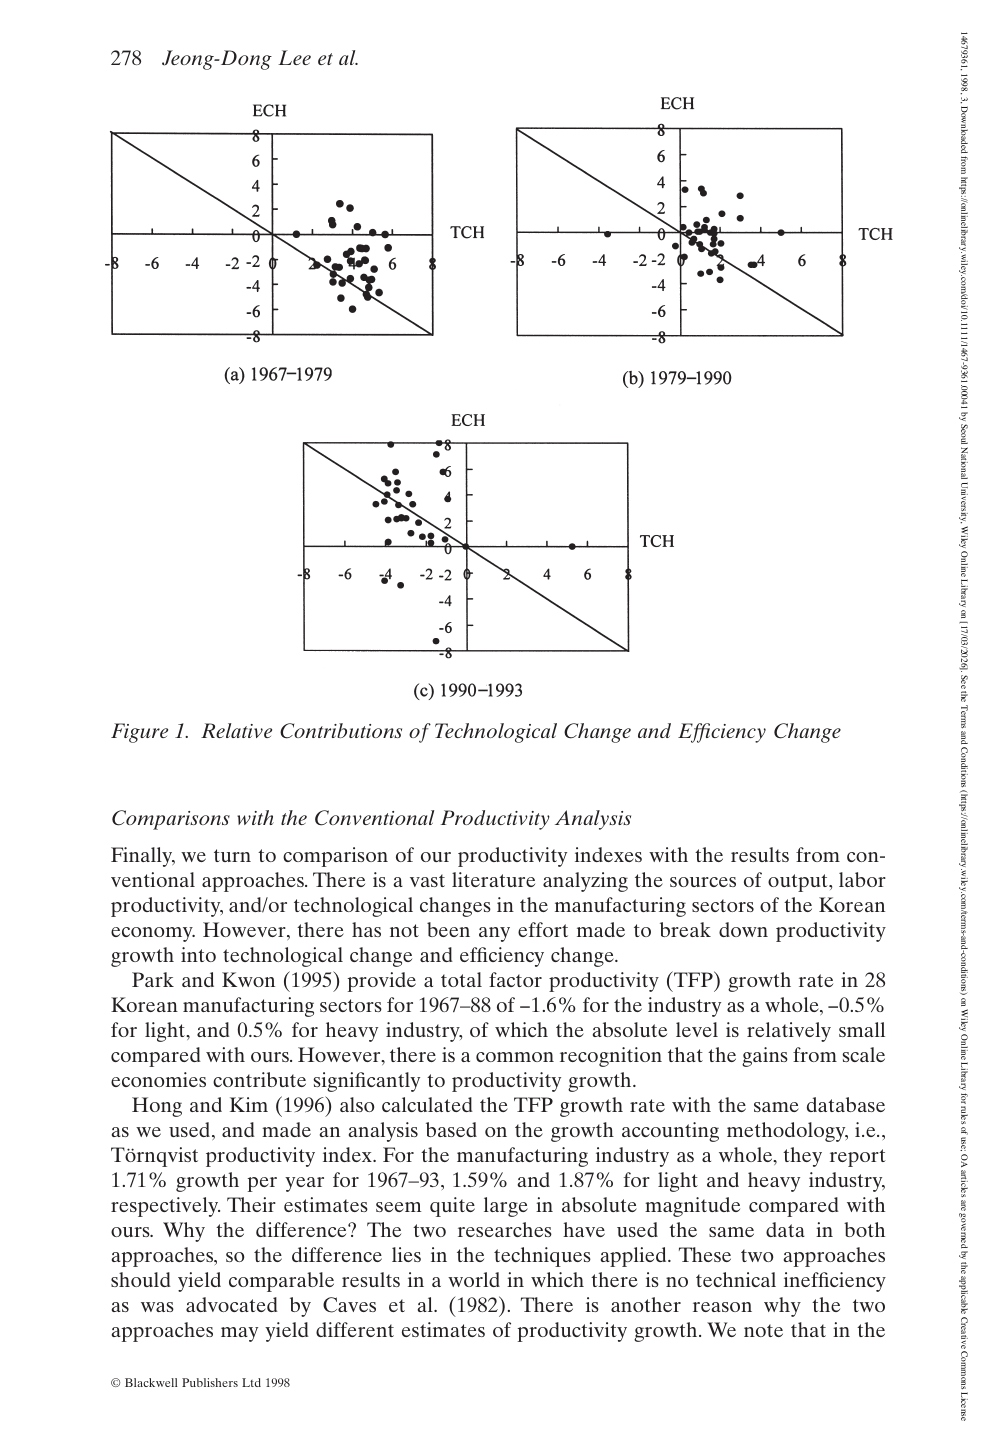
한국 36개 제조업 부문(1967–1993)의 nonparametric Malmquist 생산성 지수를 기술진보(technological change, TCH)와 기술효율 변화(efficiency change, ECH)의 두 component로 분해한다. 제조업 전체 TFP 성장은 연 0.286%로, 기술진보(+1.141%/year)가 거의 전부를 견인하고 효율 변화는 오히려 음(-0.855%/year)이었다. 32/36 sector에서 두 component가 통계적으로 유의한 negative correlation을 보이며, “기술이 빠르게 발전한 부문일수록 효율 catching-up은 약해진다”는 패턴을 한국 제조업에서 처음 정량 확인했다.
- RQ: 한국 제조업의 생산성 성장은 기술진보 vs 효율 catching-up 중 어디에서 오는가? 두 component는 어떤 정책 변수(보호율, 시장 집중도 등)와 어떻게 연관되는가?
- 방법론: Malmquist 생산성 지수, DEA, tornqvist-productivity-index, generalized-least-squares
- 데이터: 한국 36 제조업 sector, gross output·labor·capital·material, 1967–1993 (KDI Hong-Kim 1996 데이터셋); 2차 회귀는 1970·1980·1990 세 시점 108 obs
- 주요 발견: 제조업 전체 TFP +0.286%/year = TCH +1.141% − ECH 0.855%; 32/36 sector에서 TCH-ECH negative correlation 유의 (전체 Pearson r = -0.809, p<0.01); 효과적 보호율·시장 집중도가 두 component에 비대칭적으로 작용
- 시사점: 기술진보 진작 정책과 효율 개선 정책이 trade-off 관계일 수 있어, 생산성 정책 설계 시 두 component를 분리 측정해야 한다는 점을 명시
요약
1990년대 초 한국 경제가 연 9% 고성장 후 정체에 접어들면서 productivity 의 source 를 정확히 진단하는 것이 정책 우선 과제가 됐다. 그러나 당시 표준이던 growth accounting / Törnqvist 접근은 production function 의 inefficiency 가능성을 배제하고 productivity 성장을 곧 technological progress 로 동일시했다. Färe, Grosskopf 외 동료들이 1990 년대 초 제안한 nonparametric Malmquist index 는 distance function 기반으로 inefficiency 를 명시적으로 모형화하면서 productivity 를 TCH (frontier shift) 와 ECH (catching-up) 의 두 component 로 분해 가능하게 했고, 본 논문은 이 framework 을 한국 제조업 전 sector 에 처음 적용한 사례다.
저자들은 36 sector × 27 년 input-output 데이터에 DEA 기반 distance function 을 적용해 총 2,916 개 LP 문제를 풀고 sector·연도별 Malmquist index 와 두 component 를 추정했다. 결과는 일관되다 — 30/36 sector 에서 TFP 성장과 TCH 가 함께 양(+)이고, 효율 변화가 양(+)인 sector 는 8 개에 불과했다. 32/36 sector 에서 TCH-ECH 의 Pearson 상관이 -0.4 ~ -0.9 수준의 강한 음(-) 으로 유의했으며, 전체 manufacturing 에서도 r = -0.809 (p<0.01). 2 단계 GLS 회귀에서는 static efficiency 가 lagging sector 의 후속 ECH 를 끌어올리고 (catching-up 매커니즘), market concentration 은 TCH 를 진작하지만 (Schumpeterian 효과) ECH 는 끌어내리고, output growth (Kaldor-Verdoorn) 는 두 component 모두를 양(+) 방향으로 밀어준다.
본 연구는 같은 데이터에서 Hong-Kim (1996) 의 Tornqvist 추정값 1.71%/year 보다 훨씬 작은 0.286%/year 를 보고한다. 이 격차는 Malmquist 가 best-practice frontier 를 명시적 benchmark 로 사용하는 반면 conventional 접근은 sector 별 own-best 기준을 쓰기 때문에 발생한다. 한계는 명시적으로 적혀 있다 — scale efficiency 를 분리하지 않았고 (sector-specific 성격 때문), R&D 지출을 explanatory variable 에 포함시키지 못했으며 (data 한계), 2 차 회귀는 3 시점 cross-section 으로 dynamic 정보를 포착하지 못한다.
핵심 결과
Manufacturing 전체 (1967–1993, 연평균 %)
| 지표 | 값 |
|---|---|
| Malmquist TFP (M) | +0.286 |
| 기술진보 (TCH) | +1.141 |
| 효율 변화 (ECH) | −0.855 |
| TCH–ECH Pearson 상관 | −0.809** |
| TCH > 0 sector 수 | 30 / 36 |
| ECH > 0 sector 수 | 8 / 36 |
Top 5 / Bottom 5 sector (M 기준, 연평균 %)
| Top 5 (heavy industry 중심) | M | TCH | ECH |
|---|---|---|---|
| Sector 32 | 5.052 | 2.626 | 2.426 |
| Sector 25 | 3.266 | 3.180 | 0.087 |
| Sector 26 | 3.146 | 2.347 | 0.799 |
| Sector 33 | 3.043 | 2.998 | 0.045 |
| Sector 24 | 2.565 | 1.746 | 0.819 |
| Bottom 5 | M | TCH | ECH |
|---|---|---|---|
| Sector 14 | −1.061 | −1.064 | 0.003 |
| Sector 8 | −0.356 | 1.848 | −2.204 |
| Sector 17 | −0.126 | 1.498 | −1.624 |
| Sector 20 | −0.087 | 1.989 | −2.076 |
| Sector 7 | −0.073 | 0.983 | −1.056 |
2 단계 GLS 회귀 (N=108, 1970/1980/1990 cross-sections, t in parentheses)
| 설명변수 | M | TCH | ECH |
|---|---|---|---|
| Static efficiency (SE, lagged) | 0.611 (0.77) | −5.357** (−8.03) | −5.967** (−6.38) |
| Effective protection rate (PT) | 0.000584* (1.84) | 0.000451* (1.68) | 0.000133 (0.35) |
| Output growth (DY) | 0.288* (9.94) | 0.044* (1.78) | 0.245* (7.12) |
| Market concentration (CO) | −0.614 (−0.34) | 2.783* (1.84) | −3.396 (−1.60) |
| Output price growth (DP) | 0.025 (0.53) | −0.167* (−4.18) | 0.192* (3.43) |
| Capital productivity (VC) | 0.024 (1.46) | −0.088* (−6.27) | 0.113* (5.71) |
| R² | 0.547 | 0.748 | 0.474 |
* p<0.10, ** p<0.05 (단순 표기). Hong-Kim (1996) 의 Tornqvist 추정 1.71%/year 와 비교 — Malmquist 의 cross-sector frontier benchmark 가 own-best benchmark 의 Tornqvist 보다 보수적 추정을 산출한다.
방법론 노트
Malmquist 지수는 distance function 기반으로 inefficiency 를 허용하고, “frontier shift” 와 “catching-up” 을 분리 측정한다. nonparametric DEA 접근은 production function 의 functional form (Cobb-Douglas, translog 등) 을 사전 가정하지 않고 LP 로 frontier 를 직접 구성하기에, 가정 의존성이 낮다.
핵심 식:
distance function 는 기 frontier 까지의 비례 distance 의 역수.
Malmquist index 는 인접 두 기간 distance 함수의 geometric mean 으로 정의되고, 다음과 같이 두 component 로 분해된다:
각 distance 함수는 cross-sector meta-frontier 위에서 LP 로 계산된다:
식별은 “공통 production frontier 위에서 sector 간 relative performance 를 비교 가능하다 (Nishimizu-Hulten 의 social capability)” 가정에서 온다. 2 단계 GLS 회귀는 추정된 M / TCH / ECH 를 종속변수로 두고 정책·시장 변수의 부분 효과를 분리하는데, WOLS 의 heteroskedasticity·cross-equation correlation 문제를 회피하기 위해 GLS 를 채택했다.
연구 계보
본 paper 는 Färe·Grosskopf·동료들의 nonparametric Malmquist 시리즈 (Färe et al. 1990 Resources and Energy; 1994a Production Frontiers; 1994b AER; 1995 Applied Economics) 를 한국 제조업 전 sector 에 처음 적용한 사례이며, Caves-Christensen-Diewert (1982 Econometrica) 의 index theory 와 Nishimizu-Page (1982 International Economic Review, Yugoslavia) 의 frontier 분해 전통을 잇는다. Tornqvist 비교 기준은 Hong-Kim (1996, KDI) 의 같은 데이터셋 결과를 사용했다.
이정동 의 author page 분류상 제1 기 측정의 도구 (1997-2005) 의 sector-level frontier 작업에 위치한다. 같은 시기 자매편으로 천연가스 산업 panel 에 parametric translog 를 적용한 Productivity growth, capacity utilization, and technological progress in the natural gas industry 가 있다.
See also
인접 그래프
- 인물 3
- 방법론 4
- 개념 1
- 주제 1
- 수록처 1
- 분류 3
- 논문 24
이 문서를 가리키는 페이지
논문 (24)
- A fuzzy set theory approach to national composite S&T indices
- A metafrontier approach for measuring Malmquist productivity index
- Development pattern of the DEA research field: a social network analysis approach
- Driving Forces of CO2 Emissions in Emerging Countries: LMDI Decomposition Analysis on China and India's Residential Sector
- Energy and economic growth: causality analysis using decomposed energy consumption
- Estimation of the shadow prices of pollutants with production/environment inefficiency taken into account: a nonparametric directional distance function approach
- Evaluation of Sectoral Innovation System with Productivity Decomposition: Application to Korean Healthcare Sector
- Evolutionary Patterns of an Artifact: The Mobile Phone
- Impact of R&D Intensity on the Firm Growth: Evidence from Korean Manufacturing Firms
- Interindustry Knowledge Transfer and Absorption via Two Channels - The Case of Korea
- International comparison of industrial CO2 emission trends and the energy efficiency paradox utilizing production-based decomposition
- International comparisons of productivity and its determinants in the natural gas industry
- Introduction to APPC-2018, a Special Issue of the Journal of Productivity Analysis, 'Novel Applications of Efficiency and Productivity Analyses in the Asia-Pacific Region'
- Introduction: Productivity, Efficiency, and Economic Growth in the Asia-Pacific Region
- Learning by doing and spillovers: An empirical study on the TFT-LCD industry
- Manufacturing Sector Productivity Growth in the Asia Pacific Region
- Measuring consumption efficiency with utility theory and stochastic frontier analysis
- Productivity growth, capacity utilization, and technological progress in the natural gas industry
- Profitability Gains of Korean Defense Firms: Technological Progress or Cost Shifting?
- Research and development linkages in a national innovation system: Factors affecting success and failure in Korea
- The Measurement of Consumption Efficiency Considering the Discrete Choice of Consumers
- The relevance of DEA benchmarking information and the Least-Distance Measure
- The Role of FDI on Transferring Technology to Korea
- Total Factor Productivity in Korean Manufacturing Industries