Total Factor Productivity in Korean Manufacturing Industries
Inha Oh, 이정동, Almas Heshmati (2008) · Global Economic Review 37(1):23–50 · DOI ↗
1993–2003 한국 제조업 firm panel 위에서 총요소생산성 (TFP) 성장률을 세 방법론 — (i) Translog 시간 추세 모형 (TT) (TT, Kumbhakar et al 1999), (ii) Baltagi-Griffin (1988) Baltagi-Griffin general index (GI, parametric), (iii) Good et al (1999) 연쇄 다국간 지수 (non-parametric) — 으로 paired 추정해 한국 한국 외환위기 이후 영향을 정량화. 핵심 발견: (i) 위기 전 (1994–1996) 전체 TFP 성장 TT 2.6% / GI 3.7% / non-parametric 4.4% → 위기 후 (2000–2003) TT −1.2% / GI 0.5% / non-parametric 0.7% — 모든 방법에서 위기 후 성장률 급락, (ii) 기업 규모 양극화 — 위기 전 SME-LSE TFP 격차 GI 3.4% vs 8.6% (5.2%p) → 위기 후 0.4% vs 1.4% (1.0%p) 로 축소되었지만 level 은 SME 가 절대적 위축, (iii) 고기술 산업 회복 — high-tech 산업만 non-parametric 5.9% 로 위기 전 수준 회복, 저기술 산업은 음. 정책 함의: SME 의 정부 보호적 신용 정책이 non-selective 라 dynamics 왜곡, R&D 비중 차이 (LSE 2.0% vs SME 0.8%) 가 long-run 격차의 origin.
- RQ: 1997 한국 외환위기 이후 전후 한국 제조업의 TFP 성장 패턴과 firm size · 산업 · 지역별 polarization 을 어떻게 정량화하며, parametric (TT / GI) vs non-parametric (chained multilateral) 방법론 간 결과 차이는 어떻게 나타나는가?
- 방법론: 트랜스로그 생산함수 위 (i) Kumbhakar et al (1999) 의 시간 추세 모형 (TT) (TT) — pure time trend + non-neutral term, (ii) Baltagi-Griffin general index (GI) — 시간 dummy 의 general index 로 technical change 추정, (iii) Good et al (1999) 의 연쇄 다국간 지수 (non-parametric) — Tornqvist 형 누적 비교 index. 세 방법 paired 적용
- 데이터: 한국 통계청의 manufacturing firm panel (1993–2003, 5 명 이상 모든 제조업 사업체). 출력 (deflated sales) · 노동 (employee · 임금) · 자본 (capital stock) · 중간재 (intermediate input) 변수. 23 industry · 3 firm size class (≤50 / 51–300 / >300) · 5 region paired 분류
- 주요 발견: 위기 전 (1994–1996) 전체 TFP 성장 TT 2.6% / GI 3.7% / non-parametric 4.4% → 위기 후 (2000–2003) TT −1.2% / GI 0.5% / non-parametric 0.7%; firm size — LSE 가 SME 보다 항상 우위, GI 위기 전 SME 3.4% vs LSE 8.6%, 위기 후 0.4% vs 1.4%; 산업 — computer-business-machine · electrical components 가 TFP 우수, food · plastic · reproductive 가 열위; high-tech 가 non-parametric 5.9% 로 위기 후 회복, 저기술 음; 지역 — Chung-cheong (Daejeon 테크노 클러스터) 가 일관 최우위
- 시사점: 정책 함의는 명확. (i) SME 의 non-selective 신용 지원이 entry-exit dynamics 왜곡 — IMF (2005) 진단과 일치, (ii) R&D 비중 격차 (LSE 2.0% vs SME 0.8%) 가 long-run TFP 격차의 origin, (iii) 산업·지역 polarization 의 부분 회복 (high-tech, Chung-cheong) 은 R&D-driven, factor-driven 산업과 분리
요약
본 paper 는 총요소생산성 (TFP) 측정의 두 paradigm — parametric (econometric 으로 production / cost function 추정 후 derivative 로 TFP 계산) vs non-parametric (Tornqvist 형 index 로 accounting 데이터에서 직접 계산) — 의 한국 제조업 적용 비교 분석. 동일 firm panel (1993–2003) 위에서 세 방법을 paired 추정해 (i) 1997 외환위기의 productivity 충격, (ii) firm size · 산업 · 지역별 polarization, (iii) 방법론 간 결과 일치도를 동시에 측정한다.
세 방법의 차이는 (i) Translog 시간 추세 모형 (TT) (TT, Kumbhakar-Heshmati-Hjalmarsson 1999) — 시간 trend 와 trend × input cross term 으로 technical change 의 시간 effect 식별, (ii) Baltagi-Griffin (1988) Baltagi-Griffin general index (GI) — 시간 dummy 의 general index 로 technical change 의 non-monotonic 패턴 식별 (위기 같은 불연속 충격에 더 적합), (iii) Good-Nadiri-Sickles (1999) 연쇄 다국간 지수 (non-parametric) — output / input growth rate 의 chained 누적 비교 index, equilibrium 가정과 CRS 강한 가정 필요. 세 방법 모두 한국 통계청의 1993–2003 manufacturing firm panel (5 명 이상 모든 제조업) 에 적용 — 23 산업 분류 + 3 firm size class + 5 지역.
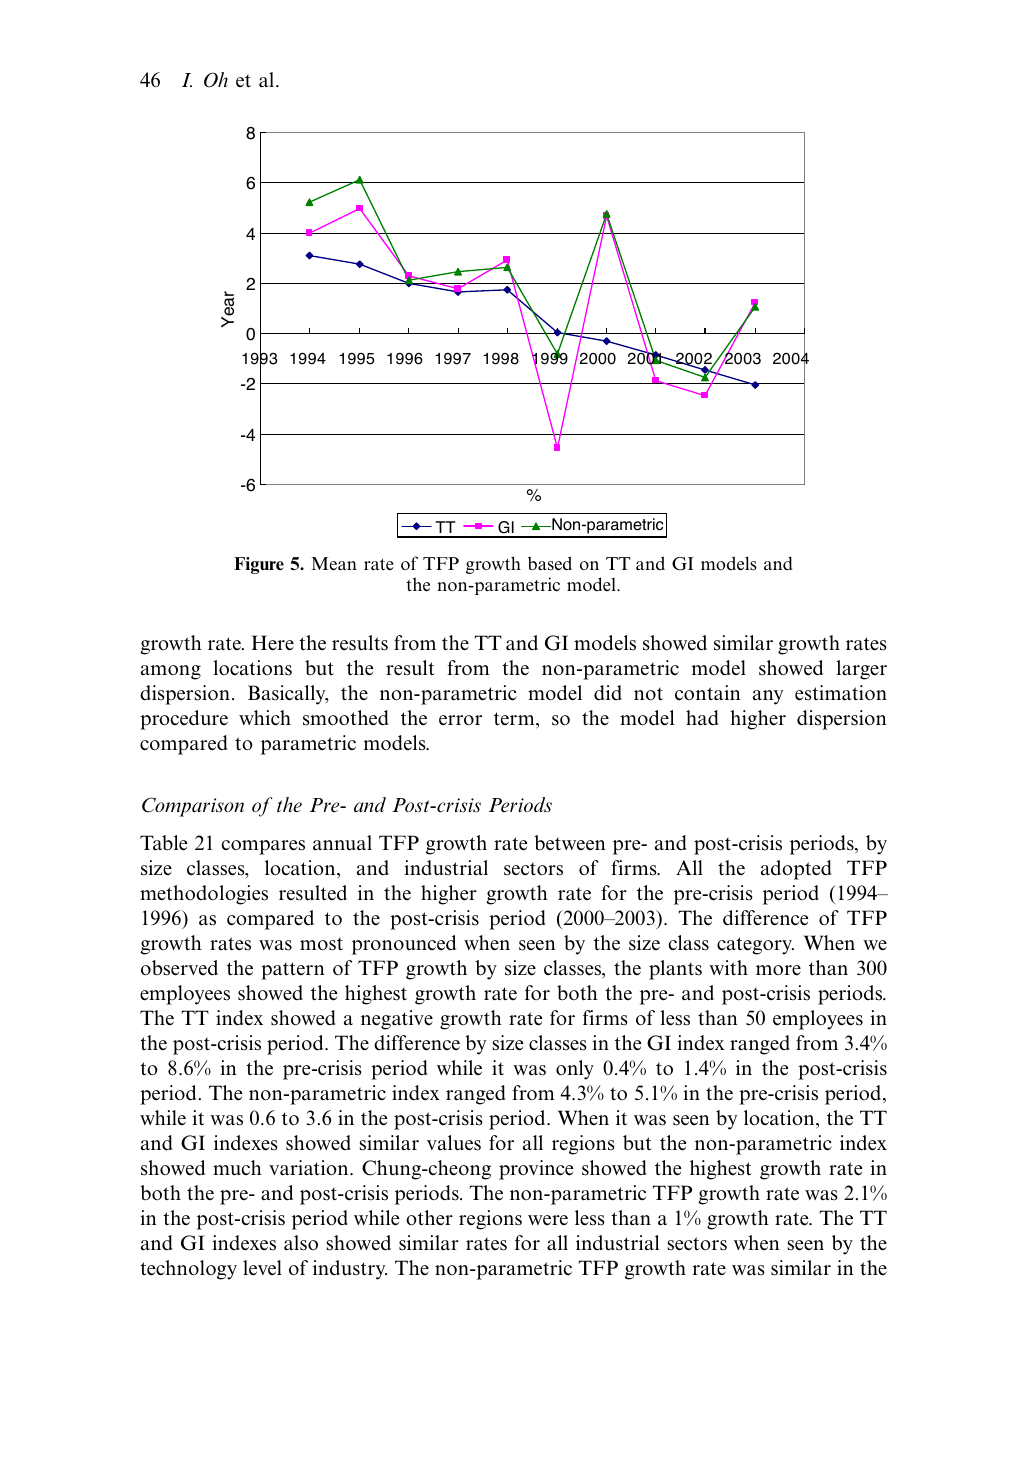
핵심 발견은 세 갈래. 첫째, 1997 외환위기의 TFP 충격이 모든 방법에서 confirmed. 위기 전 (1994–1996) 평균 TFP 성장률 TT 2.6% / GI 3.7% / non-parametric 4.4% → 위기 후 (2000–2003) TT −1.2% / GI 0.5% / non-parametric 0.7%. TT 모형은 smoothed pattern 으로 위기 후 음 성장 record 하지만 GI / non-parametric 은 위기 후 0 근방 — TFP 성장 자체가 사실상 멈춤. Fig. 5 의 시계열에서 1998–1999 의 sharp drop 이 모든 방법 공통, 2001–2002 의 2 차 drop 도 GI · non-parametric 에서 visible. 둘째, firm size polarization 의 양면성. LSE 가 SME 보다 위기 전·후 모두 TFP 우위 — 위기 전 GI 8.6% (LSE) vs 3.4% (SME) → 위기 후 1.4% vs 0.4%. 격차 비율 은 위기 후 5.2%p → 1.0%p 축소, 하지만 level 의 SME 가 절대적 위축 (3.4 → 0.4). R&D 비중 격차 (LSE 1.5–2.0% vs SME 0.5–1.0%) 가 long-run origin. IMF (2005) 의 “한국 SME 정부 신용 지원이 non-selective 이라 entry-exit dynamics 왜곡” 진단과 본 paper 의 정량 evidence 일치. 셋째, 산업·지역 polarization 의 부분 회복. 비parametric 추정에서 high-tech 산업 (computer · electrical components 등) 이 위기 후 5.9% 로 위기 전 5.8% 와 거의 동일 — high-tech 만 회복, 반면 low-tech 와 medium-low-tech 는 음 성장. 지역적으로는 Chung-cheong (Daejeon 테크노밸리) 이 일관 최고 TFP — 산업 클러스터 effect. Returns-to-scale 도 firm size 와 connected — 50 명 이하 RTS 0.96 (감소수익) vs 300 명 이상 RTS 1.05 (증가수익). 영세 firm 은 너무 작음, 대형은 최적 위.
방법론 간 결과 비교의 incremental finding: GI 와 non-parametric 모형의 TFP 성장률 상관 0.123 (1% 유의) — 분리 수준에서는 큰 차이지만 aggregate level 에서 패턴 유사. 저자 해석은 RTS 가 1 에 가까울 때 GI 와 non-parametric 의 격차가 줄어든다는 것 — 한국 제조업 평균 RTS 가 0.97–0.99 라 두 방법 aggregate 결과 호환. TT 의 smoothed 패턴은 시간 trend 의 단일 변수 가정이 위기 충격을 absorb 못한 결과 — GI 가 한국 위기 분석에는 더 적합. 한계는 (i) firm-level panel 의 selection bias (사망 firm 의 attrition), (ii) 자본 측정의 PIM 가정 robust, (iii) regional 분류의 metropolitan 효과 통제 어려움.
핵심 결과
Overall TFP 성장률 (Table 21, 위기 전후 비교, %)
| Index | 위기 전 (1994–96) | 위기 후 (2000–03) | Δ |
|---|---|---|---|
| TT (Translog time-trend) | 2.6 | −1.2 | −3.8 |
| GI (Baltagi-Griffin general index) | 3.7 | 0.5 | −3.2 |
| Non-parametric (chained multilateral) | 4.4 | 0.7 | −3.7 |
→ 세 방법 모두 위기 후 3–4%p drop. TT 만 음.
Firm size 별 TFP 성장 (위기 전후 GI · non-parametric)
| Size | Pre GI (94–96) | Pre NP | Post GI (00–03) | Post NP |
|---|---|---|---|---|
| ≤50 명 | 3.4% | 4.3% | 0.4% | 0.6% |
| 51–300 명 | 6.1% | 5.0% | 1.2% | 1.9% |
| >300 명 | 8.6% | 5.1% | 1.4% | 3.6% |
→ LSE 가 두 시기 모두 우위. R&D 비중 (LSE 2.0% vs SME 0.8%) 의 origin.
산업별 TFP 성장 (Table 18, %, 1993–2003 평균)
| 산업 (high-TFP) | TT | GI | NP | 산업 (low-TFP) | TT | GI | NP |
|---|---|---|---|---|---|---|---|
| Tobacco | 4.13 | 6.12 | −1.67 | Reproductive | −0.44 | 0.36 | 2.45 |
| Computer · 기계 | 0.99 | 1.53 | 0.12 | Publication & press | 0.33 | 1.11 | −2.19 |
| Electrical components | 0.97 | 1.52 | 5.34 | Pulp & paper | 0.46 | 1.27 | −1.19 |
| Electrical machinery | 0.54 | 1.20 | 4.48 | Petroleum products | 0.65 | 1.47 | −1.13 |
→ Electrical components · machinery 가 non-parametric 에서 매우 큰 양 — high-tech R&D 회복.
Returns to scale (Table 13, firm size 별)
| Firm size | RTS (TT) | RTS (GI) |
|---|---|---|
| ≤50 명 | 0.963 | 0.964 |
| 51–300 명 | 1.010 | 1.009 |
| >300 명 | 1.052 | 1.050 |
→ 영세 firm decreasing, 대형 firm increasing returns to scale.
Technology change rate (Table 16, %)
| Firm size | TT model | GI model |
|---|---|---|
| ≤50 명 | 0.81 | 1.12 |
| 51–300 명 | 2.14 | 1.86 |
| >300 명 | 3.12 | 2.49 |
→ Technical change 도 firm size 와 strongly 양 상관.
방법론 노트
생산함수의 일반적 표현 에서 총미분으로:
비용 최소화 + 경쟁시장 가정으로 TFP 성장률은:
비용 share, scale elasticity 합. TFP 성장은 technical change () + scale 효과 () 로 분해.
Translog 시간 추세 모형 (TT) (TT) 의 함수 형태 (Kumbhakar et al 1999):
가 pure time trend, 가 input-augmenting non-neutral component. Technical change rate = .
Baltagi-Griffin Baltagi-Griffin general index (GI) 는 time trend 의 단일 변수 가정을 시간 dummy 의 general index 로 일반화:
가 non-parametric time index — 시간별 dummy 의 정규화된 합. 위기처럼 불연속 충격 의 effect 를 더 잘 capture. Technical change = .
Non-parametric 연쇄 다국간 지수 (Good-Nadiri-Sickles 1999) 은 Tornqvist 형 누적 비교:
cross-section mean () 대비 deviation 으로 firm-level TFP level 측정. 강한 가정 — 비용 최소화 + CRS + price-taking — 필요.
식별은 (i) 1993–2003 11 년 panel 의 시간 변동에서 technical change, (ii) firm-level 의 input-output 변동에서 elasticity, (iii) firm size / 산업 / 지역 segmentation 의 cross-sectional 변동에서 heterogeneity 식별. 한계는 (i) 자본 측정의 perpetual inventory method 가정 — capital stock 의 depreciation rate · initial assumption robustness, (ii) firm attrition 의 selection bias — survival 한 firm 만 panel 에 잔존, (iii) 가격 deflator 의 산업별 통일 가정.
연구 계보
본 paper 의 TFP 측정 방법론 lineage 는 Solow (1957 Review of Economics and Statistics) 의 growth accounting 표준 위에 (i) Parametric — Christensen-Jorgenson-Lau (1973) 의 translog 함수 도입, Kumbhakar (1996) 의 stochastic frontier, Kumbhakar-Heshmati-Hjalmarsson (1999 Journal of Productivity Analysis) 의 dynamic TFP, Kumbhakar-Heshmati (2000) 의 panel approach, Baltagi-Griffin (1988 International Economic Review) 의 general index 가 핵심 lineage. (ii) Non-parametric — Caves-Christensen-Diewert (1982) 의 Tornqvist 인덱스, Good-Nadiri-Sickles (1999) 의 chained-multilateral 표준화.
한국 제조업 TFP lineage 는 Kim (1996) 의 한국 산업정책 1962–1993 phase 분류, Kim-Lee (2002 Asian Economic Papers) 의 한국 외환위기 corporate sector 분석, Borensztein-Lee (2002 Journal of International Money and Finance) 의 위기 후 자본 배분 변화, Crotty-Lee (2002 Journal of Economic Issues) 의 state-to-market transition 비판, Cho (2004), Gregory-Tenev-Wagle (2002) 의 SME 경쟁력 분석. Industrial polarization 시각은 IMF (2005) 의 한국 보고서 + Gustavsson-Poldahl (2003) 의 스웨덴 turnover rate proxy.
TEMEP 내 sibling cluster: (i) Technological Progress versus Efficiency Gain in Manufacturing Sectors — 이정동 의 productivity 분해 라인의 직접 predecessor (Malmquist-Solow framework), (ii) The Role of FDI on Transferring Technology to Korea — 같은 batch 의 한국 제조업 productivity 분석 (FDI spillover 시각), (iii) Inha Oh 의 TFP · DEA 라인의 후속 작업들 — credit guarantee · 자동차 efficiency · ESCO 분석. 본 paper 는 Inha Oh 의 국가 차원 productivity 측정 능력 정립 paper 로, 이후 Evaluation of credit guarantee policy using propensity score matching 등 정책 평가 작업의 토대.
Almas Heshmati 는 SNU 외부 (Korea University 등) 공저자로 Kumbhakar 라인의 productivity econometrics 전통을 한국 데이터에 직접 응용한 lineage 의 collaborative anchor.
See also
- 총요소생산성
- 트랜스로그 생산함수
- 시간 추세 모형 (TT)
- Baltagi-Griffin general index
- 연쇄 다국간 지수
- 모수 TFP 추정
- 비모수 TFP 추정
- 한국 외환위기 이후
- 기업 규모 양극화
- 규모에 대한 수익
- Technological Progress versus Efficiency Gain in Manufacturing Sectors
- The Role of FDI on Transferring Technology to Korea
- Inha Oh
- 이정동
인접 그래프
- 인물 3
- 방법론 7
- 개념 2
- 주제 2
- 수록처 1
- 분류 1
- 논문 10
이 문서를 가리키는 페이지
논문 (8)
- A metafrontier approach for measuring Malmquist productivity index
- Analysis of product efficiency in the Korean automobile market from a consumer's perspective
- Comparative Analysis of Plant Dynamics by Size: Korean Manufacturing
- Evaluation of credit guarantee policy using propensity score matching
- Evaluation of Sectoral Innovation System with Productivity Decomposition: Application to Korean Healthcare Sector
- Profitability Gains of Korean Defense Firms: Technological Progress or Cost Shifting?
- The Effect of Asset Composition Strategy on Venture Capital Firm Efficiency: An Application of Data Envelopment Analysis
- The relevance of DEA benchmarking information and the Least-Distance Measure